Southern Africa is not flat. Most of the region’s land is divided into river basins, and within these basins, terrain determines the direction of flow for every drop of rain that falls. All water in a basin – whether on the surface or underground – tends to stay in that basin until it evaporates or flows out through a central river to the ocean.
River basins, usually named after their central rivers, are important geographic spaces. Their water resources bind together all the people and ecosystems within them. Yet basins don’t usually line up with national boundaries, and people may not even know which river basin they live in. Few maps show this view of Southern Africa. It is, however, a view with great consequence in an era of water and climate challenges: these basins are home to millions, and their water resources are needed not just for the functioning of natural systems but for household use, agriculture and industry, too.
This map presents an overview of the 14 major river basins in the Southern African Development Community (SADC), 1 including details about recent projects undertaken in them; the natural, socio-economic and agricultural factors at play there; and the threats to their precious water resources.
All of these basins are transboundary basins: they extend into more than one country. Transboundary water management must be carefully and collaboratively planned to avoid any potential for conflict and maintain the equitable, sustainable availability of water. Throughout SADC, where extremes of climate change are affecting the poorest residents most severely, the management of water resources is critical to ensuring climate resilience and sustainable development for all. This effort requires a transboundary river basin point of view.
1 With the exception of the Nile Basin, which reaches into northern parts of Tanzania and the Democratic Republic of Congo.
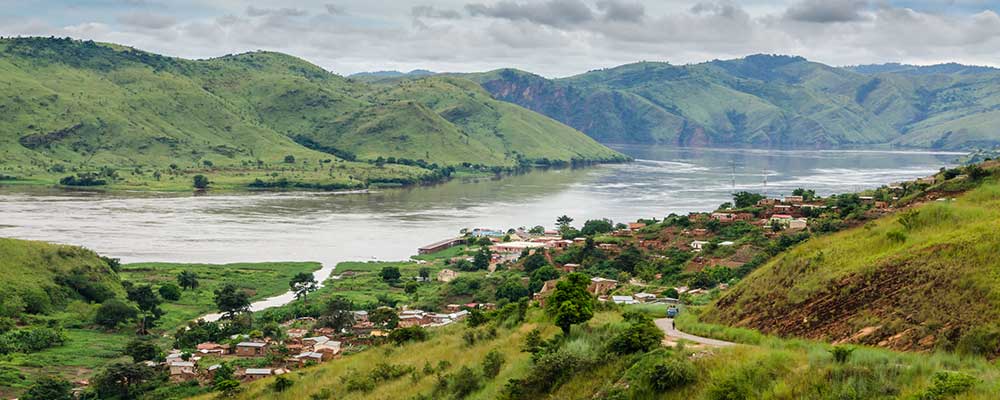
Countries: Angola, Cameroon, Central African Republic, Democratic Republic of the Congo, Republic of the Congo, Zambia
River Basin Commission: Commission Internationale du Bassin Congo-Oubangui-Sangha
Size: 4 million km2
Length of main river: 4,374 km [1]
Population: Over 85 million [2,3]
The Congo Basin is the biggest river basin in Africa, and second largest in the world after the Amazon Basin, [4,5]. In its centre is the Democratic Republic of the Congo, landlocked except for a 40 km coastline on the west. The Congo River is the deepest in the world, with recorded depths of 230m. It is fed by many tributaries, the most important of which are the Lomami, Aruwimi and Ubangi rivers. [5,6]
The Congo River provides an important transportation route across central Africa, although islands and waterfalls in the river make certain stretches unnavigable. The population of the Congo River Basin relies on small-scale agriculture, logging and the growing mining industry and oil production for its livelihoods. [5]
The Congo Basin holds the second largest tropical rainforest in the world, at almost 2 million km2. The forest is home to more than 200 different types of fish, 400 types of mammal and over 10,000 plant species, making it the most biodiverse area of the African continent. Despite this, the region is relatively understudied, and many more surveys will have to be carried out to fully understand its conservation requirements. [7]
The Basin falls into three different climate zones: tropical, equatorial and temperate. Temperatures fluctuate around 26OC and average humidity is high at 78%. The dense rainforest is a strong regulator of regional weather, enhancing the rainfall which supports the diverse plant and animal community. Because of its location straddling the equator and within the Inter Tropical Convergence Zone, the river flow of the Congo is relatively stable. [7]
The Congo River provides 30% of Africa’s fresh water resources, with 77 million people relying on its flow. [7] The river has high hydropower potential, most of which is as yet unharnessed.
The river is a major transport and trade route for communities living in the Basin, as dense rainforest and variable topography means that road networks in the area are relatively sparse and difficult to navigate. The Basin is also home to 150 distinct ethnic groups, many of whom still practise a traditional hunter-gatherer lifestyle. [8]
Fish represent over 40% of the animal protein supply to people living in the Democratic Republic of the Congo, and as such, over 20% of the population living in the rainforests of Central Africa is thought to be engaged in river fisheries. [9]
Over 59% of the population of the Basin is rural, and many are farmers. Shifting cultivation has been the main farm practice in the Basin for millennia, due to the low level of nutrients in the soil. The full extent of this practice is difficult to record and analyse but new satellite technology has allowed researchers to follow shifting plots. [10] Understanding these trends can help governments put policies in place to regulate and protect local farming communities.
Climate change is the primary threat in the Congo Basin due to its ability to compound all other regional threats. Rising temperatures and shifting rainfall patterns have the potential to cause significant hydrological change in the local water cycle, affecting all human, animal and plant life that depends on the river network. This includes fish farming, which is dependent on the seasonal flood cycle that brings additional nutrients from the forest soil to the river ecosystems. [2]
The Congo Basin population increases by over 1.7 million people each year. These people need food, shelter, work, fuel and other amenities, putting further strain on local resources.
An estimated 95% of factories in the Democratic Republic of the Congo discharge their waste directly into the river network. Decreased water quality can cause poor health for Basin inhabitants that use the river for drinking, washing and household chores, as well as wildlife living in or along the river.
The Congo Basin loses 1.5 million ha of forest each year. Much of this is due to felling for charcoal production and clearance for oil palm conversion. [11] Reduced canopy cover causes changes in local rainfall patterns and an increase in surface runoff. This can lead to an increased number of flash flood events, as well as increased sediment deposition in rivers. [8] Forest biodiversity levels are also at risk from tree felling, which removes the habitats that local wildlife depend on.
Mining activities near the river results in sediment deposition and reduced river depth. This has a major impact on the migration of fish that live in the river, as well as the boats that are the main form of transport for local people, which may be unable to navigate the shallow waters.
New dams and associated hydropower facilities have the potential to impact flow regimes and sediment load of the river. New infrastructure must be introduced sustainably to ensure minimal negative impacts.
[1] Runge J. The Congo River, Central Africa. In: Gupta A, editor. Large Rivers: Geomorphology and Management. Hoboken: Wiley. 2007;293–309
[2] Harrison IJ, Brummett R, Stiassny MLJ. The Congo River Basin. In: Finlayson CM, Milton R, Prentice C, Davidson NC, editors. The Wetland Book II: Distribution, Description, and Conservation. Dordrecht: Springer Science+Business Media. 2016
[3] WWF. Congo Basin [Internet]. Available from: https://www.worldwildlife.org/places/congo-basin
[4] UN Environment. Africa Major River Basins [Internet]. Available from: http://www.grida.no/resources/5176
[5] Lemarchand, R, Ntsomo Payanzo, N, Wiese, B M and Cordell, D D. Democratic Republic of the Congo [Internet]. 11 July 2019. Available from: https://www.britannica.com/place/Democratic-Republic-of-the-Congo
[6] Watch. Congo River Basin [Internet]. Available from: http://www.waterandclimatechange.eu/river-basin/congo
[7] Brummett R, Tanania C, Pandi A, Ladel J, Munzimi Y, Russell A, Stiassny M, Thieme M, White S, Davies D. Water resources, forests and ecosystem goods and services. In: De Wasseige C, Devers D, de Marcken P, Eba’a Atyi R, Nasi R, Mayaux P, editors. The Forests of the Congo Basin: State of the Forest 2008. Luxembourg: Publications Office of the European Union. 2009.;1411–1457
[8] Yale School of Environmental Studies. Global Forest Atlas: The Congo Basin Forest [Internet]. 2019. Available from: https://globalforestatlas.yale.edu/region/congo
[9] Béné C, Steel E, Kambala Luadia B, Gordon A. Fish as the “bank in the water”: Evidence from chronic-poor communities in Congo. Food Policy. 2009;34:108-118
[10] Global Forest Watch. New map helps distinguish between cyclical farming and deforestation in the Congo Basin [Internet]. 16 January 2018. Available from: https://blog.globalforestwatch.org/data-and-research/new-map-helps-distinguish-between-cyclical-farming-and-deforestation-in-the-congo-basin
[11] Brummett R, Stiassny M, Harrison I. Background. In: Brooks EGE, Allen DJ, Darwall WRT, editors. The Status and Distribution of Freshwater Biodiversity in Central Africa. Gland: IUCN. 2011;1–20
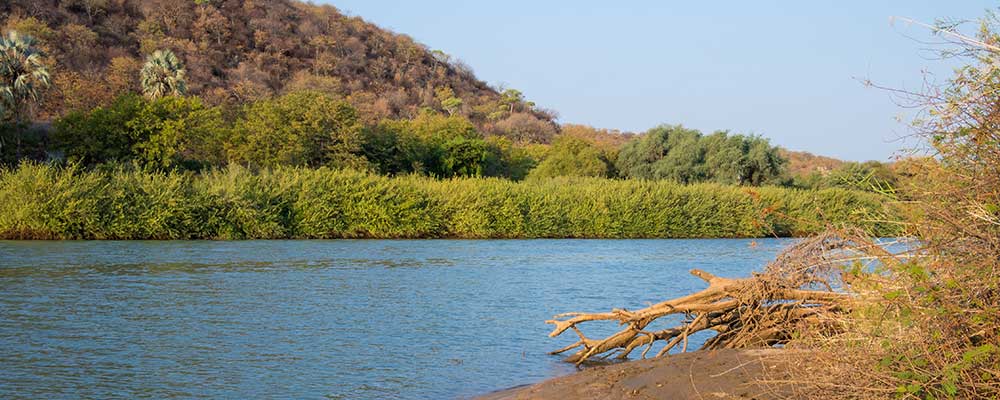
Countries: Angola, Namibia
River Basin Commission: Kunene Permanent Join Technical Commission (PJTC) [2]
Size: 106,500 km2 [2]
Length of main river: 1,100 km
Population: Over 1 million [3,5]

The Kunene Basin spans areas of Angola and Namibia. The Basin of more than 100,000 km2 includes the rivers Kunene, Kuanwza and Queve, all with sources in the Angolan central highlands, and the Epupa and Ruacana waterfalls. It also includes relatively flat floodplains in the mid-section of the rivers, and rocky arid areas on the border of the two countries. [2]
The largest river in the Basin is the Kunene, which is 1,100 km long. It begins in the highlands of southwestern Angola and flows southwards, eventually forming the border between Namibia and Angola before discharging into the Atlantic Ocean. [2,3]
On the Angolan side, roughly two-thirds of the land adjacent to the Kunene is part of Iona National Park. On the Namibian side, much of the area is within the Skeleton Coast National Park. [3]
The Kunene River Basin is characterised by diverse climate patterns and eco-geographical regions, ranging from regions with abundant precipitation in the upper Basin to water scarcity in the lower Basin. [2]
Zone |
Description |
Angolan Afromontane Forest |
Tropical and subtropical broadleaf forests |
Angolan Miombo Woodland |
Tropical and subtropical grasslands, savannas and shrublands |
Kalahari Acacia-Baikiaea Woodland |
Tropical and subtropical grasslands, savannas and shrublands |
Angolan Mopane Woodland |
Desert and xeric shrublands |
Nama Karoo |
Desert and xeric shrublands |
The average rainfall in the region ranges from 350 mm in the east to 50 mm on the coast. This difference in rainfall is mirrored by the vegetation. Temperatures also vary widely, ranging from 20°C by the coast to over 40°C inland during the summer months. Humidity therefore also ranges from 10–90%. Because of these varied conditions, the river volume in one year can differ eleven-fold between high and low seasons. The water quality is high, relatively unpolluted with low concentrations of phosphorus as well as other nutrients. [3]
The lower Kunene River contains many fish species, seven of which are endemic. A range of other invertebrates, reptiles and amphibians are also present such as turtles and crocodiles. There are three endemic mammals in the area: the mountain ground squirrel, Kaokoveld dassie and black-faced impala. [3]
The population in the Kunene Basin is made up of many different groups of Bantu and non-Bantu groups. One of the largest groups present are the semi-nomadic Himba people. [1,2]
The first dam and electricity station in the Kunene Basin was built at Matala. The works were completed in 1954. [1] This dam raises the river by approximately 8 m for hydroelectric power generation. [3]
The Basin also has several mines. In Angola, copper, lead, zinc, mica and uranium deposits are present. Not all mines have resumed operation after the Angolan civil war, however. On the Namibian side garnet, blue sodalite, titanium, nickel, lead, zinc and copper can be found in small deposits. Currently, there are two garnet mines and one blue Sodalite mine in operation. [2]
Subsistence agriculture and pastoralism are carried out across the Kunene Basin in both Angola and Namibia. [2]
In Angola, agriculture is constrained by poor soils and limited and erratic rainfall. The main crops are millet, sorghum and maize, with some intercropping of pumpkin, bean and groundnut. In Namibe Province olives, grapes and citrus are also grown. Traditional livestock farming of cattle, sheep and goats is also practiced on a small scale. [2,3]
On the Namibian side, small-scale horticulture is carried out in the wet season. The main crops here are also millet, sorghum, maize and pumpkins. Yields are generally low. Himba households keep sheep, goats and cattle. Goats and sheep are the major sources of meat, whereas cattle are a form of wealth and slaughtered mainly on special occasions. [2]
A major threat to the Basin is the proposed hydroelectric scheme on the Kunene River. The Namibian and Angolan governments plan to build this downstream of the Baynes Dam. The potential impacts of the project are largely unknown, but 57 km2 of Himba tribal lands would be flooded, including ancestral graves and critical riparian ecosystem. Mid-2018, the agreement between Angola and Namibia for the dam was being finalised. [1,4]
The greatest threat to the forest areas in the upper and middle Kunene is logging and harvesting of forest products. [2]
People who were formerly displaced are now returning to their farming areas in the upper Kunene. This increased land use is leading to degradation of the fertile forest areas of the upper Kunene. [2]
[1] International Rivers. Kunene River, Namibia [Internet]. Available from https://www.internationalrivers.org/campaigns/kunene-river-namibia
[2] Kunene River Awareness Kit [Internet]. Available from: http://www.kunene.riverawarenesskit.com/KUNENERAK_COM/INDEX.HTM
[3] ERM. Baynes Hydropower Environmental, Social and Health Impact Assessment (ESHIA): Final Scoping Report. 2009. Available from: https://www.erm.com/contentassets/95d597ddb44b4017b76742465a43ef07/full_version_finalscopingreportoctober09.pdf
[4] Hydropower & Dams International. Namibia: Country Profile [Internet]. 2018. Available from: https://www.hydropower-dams.com/news/namibia-country-profile/
[5] Namibia [Internet]. 2005. Available from: http://www.fao.org/nr/water/aquastat/countries_regions/NAM/NAM-CP_eng.pdf
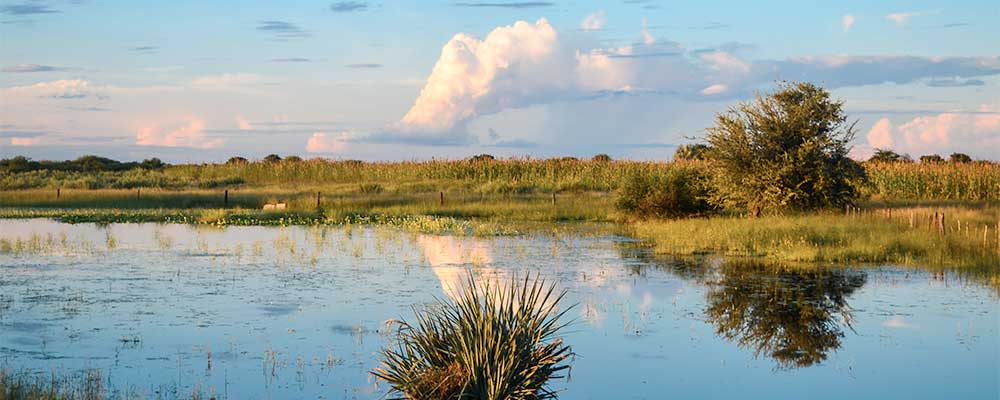
Countries: Angola, Namibia
River Basin Commission: Cuvelai River Basin Watercourse Commission (CUVECOM)
Size: 159,620 km2
Length of main river: No main river; a system of shifting small waterways
Population: 1.2–2 million [1,2,3]
The Cuvelai Basin is a transboundary wetland extending over 450 kilometres from north to south across Angola and Namibia. It is neither a delta nor a river but a drainage system consisting of hundreds of channels that disperse water across the landscape. [2]

While two-thirds of the Cuvelai Basin’s geographical area is located in Namibia, the higher rainfall and the slightly raised elevation of the Basin in the north mean that Namibia is heavily affected by changes to water flow in Angola. [4] Due to the semi-arid climate and high variability of rainfall in the region (rainfall can vary up to 60% from year to year [5]), the Basin is prone to both floods and drought. [2]
Despite these risks, the population density in the Basin is relatively high. The Cuvelai Basin supports upwards of 2 million people, [1] most of whom are directly dependant on agriculture, livestock, fisheries and other natural resources for their livelihoods. [3]
In Angola and Namibia, the Cuvelai Basin stretches across seven regions: Cunene, Cuando Cubango and Huila Provinces of Angola and the Omusati, Ohangwena, Oshana and Oshikoto regions of Namibia. [4]
Most of the water in the Cuvelai Basin originates in Angola and then spreads south into Namibia in an interconnected system of shallow watercourses. [5] In the Basin there is no outflow of surface water; all the water evaporates, is transpired by plants or seeps away into the ground. [6]
The majority of rainfall in the Basin occurs between October and March, with the highest falls occurring in December, January and February. [4] The reliable supply of fresh water is a constant issue for residents of the Basin, as rainfall during this time can vary up to 60%, often leading to either extreme flooding or droughts. Alongside this variable rainfall, the complex water distribution system across the Cuvelai Basin means that seasonal temperature changes can also cause regular flooding or droughts in key areas. [5]
The Basin is primarily inhabited by rural households, which account for 84% of the population. [4] The highest population density is in the south, with over 40% of the Namibian population living in the Basin. [6]
Fertile soils and the availability of fresh water have made the Cuvelai an attractive settlement area, with a rapidly growing population. [3] Increasing population pressures and the threat of climate change mean that the population of the Basin, heavily dependent on agriculture, livestock, fisheries and other natural resources, is vulnerable to the highly variable nature of rainfall within the Basin. [2]
Rainfed agriculture is one of the main livelihoods within the Cuvelai Basin, [4] with many in rural households relying on the Basin’s natural resources. The fresh water needed for these agricultural livelihoods is dependent on the many drainage channels spanning across the Basin as well as a range of hand-dug wells and boreholes. [6]
High variability of rainfall within the Cuvelai Basin often leads to drought events, particularly in the southern areas of the Basin that rely on water flowing from the north. The Basin saw severe drought events in the late 1980s and mid 1990s, as well as more recently in 2012, 2015 and 2016. [1]
The Cuvelai Basin has experienced regular flooding for centuries. In the past 60 years the Basin has seen exceptionally high levels of water and flooding nine times. [4] From 2008 to 2011 the Cuvelai Basin saw extensive flooding that killed over 200 people and displaced over 200,000. [2] This flooding often also destroys crops across the Basin, putting thousands more at risk of food shortages and famine. [7]
[1] Luetkemeier R, Stein L, Drees L, Liehret S. Blended Drought Index: Integrated Drought Hazard Assessment in the Cuvelai-Basin. Climate. 2017;5:51
[2] UNDP. Project Information Framework: Promoting Climate-Resilient Development – Cuvelai River Basin, Angola. 9 October 2012. Available from: https://www.adaptation-undp.org/resources/pifs/pif-promoting-climate-resilient-development-cuvelai-river-basin-angola-09-oct-2012
[3] Cuvelai Watercouse Commission. People & The River [Internet]. Available from: https://www.cuvecom.org/people-and-the-river/
[4] Mendelsohn J, Weber B. The Cuvelai Basin: Its Water and People in Angola and Namibia. Development Workshop Angola. 2011. Available from: https://www.dw.angonet.org/content/cuvelai-basin-its-water-and-its-people-angola-and-namibia
[5] CuveWaters. Omeya ogo omwenyo – Water is life. 2015. Available from: http://www.cuvewaters.net/fileadmin/edit/Downloads/Publications/CuveWaters-report-2015.pdf
[6] Beyer, M et al. Water resources in the Cuvelai-Etosha Basin. In: Revermann R, Krewenka KM, Schmiedel U, Olwoch JM, Helmschrot J, Jürgens N, editors. Climate Change and Adaptive Land Management in Southern Africa – Assessments, Changes, Challenges, and Solutions. Biodiversity & Ecology No. 6. Göttingen & Windhoek: Klaus Hess Publishers. 2018;84–85
[7] OCHA. Southern Africa: Floods and Cyclones Situation Report No. 6 [Internet]. 29 April 2009. Available from: https://reliefweb.int/report/angola/southern-africa-floods-and-cyclones-situation-report-no-6
Countries: Angola, Botswana, Malawi, Mozambique, Namibia, Tanzania, Zambia, Zimbabwe
River Basin Commission: Zambezi Watercourse Commission (ZAMCOM)
Size: 1.4 million km2
Length of main river: 2,574 km
Population: Over 30 million [1]

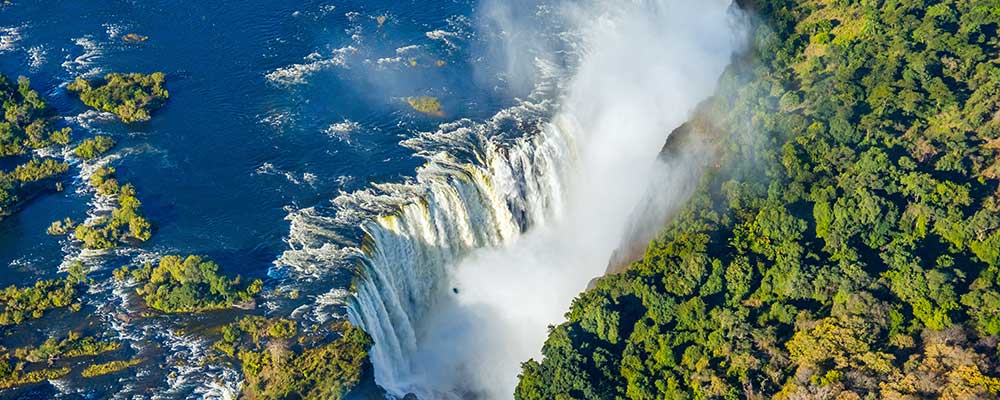
The Zambezi River rises to 1,450 m above sea level, before flowing into Angola, Namibia, Botswana, Zimbabwe and Mozambique, where it reaches the Indian Ocean. [1] Water from Malawi and Tanzania contribute to the Zambezi Basin area, which covers approximately 1.4 million km2, making it the largest river basin in Southern Africa. [3,4]
The main Zambezi Basin contains 13 major sub-basins which are spread within the Upper Zambezi Region, Middle Zambezi Region and Lower Zambezi Region. [3] The Upper Basin ends in the famous Victoria Falls.
Eight nations are involved in ZAMCOM, whose objective is “to promote the equitable and reasonable utilization of the water resources of the Zambezi Watercourse as well as the efficient management and sustainable development thereof”. [5]
In its support of ZAMCOM strategy, CRIDF is helping integrate climate resilience into the planning and development of water infrastructure. This will ensure water and food security for the rural poor and in so doing increase their resilience to climate change.
2017–ongoing
The Kazungula Water and Sanitation Project aims to provide sustainable and equitable access to a safe water supply and appropriate sanitation in the Zambian border town of Kazungula, located on the border with Botswana. The proposed work includes expanding and upgrading the existing water treatment plant, constructing a new bulk water supply pipeline, and increasing reservoir capacity to provide water to over 5,000 inhabitants in the town. This is particularly important for reducing the transmission of water-borne diseases across borders, which can stifle trade and other commercial and social activities within the region. By providing safe water resources the project aids in the facilitation of regional and international trade.
2014–ongoing
Malawi and Tanzania are working together to develop dams and associated power stations, irrigation schemes and social development initiatives on the Songwe River. Through the African Development Bank, the two governments invested nearly £5 million on a detailed design project and requested CRIDF support to develop a financial strategy and provide an expert panel on dam safety, enabling both countries to fully explore the potential for public– private partnerships. CRIDF financial analysis was presented at a donor conference in May 2017 and CRIDF is now providing further support for the development and financing of projects that will support water supply and sanitation at the border crossing between Malawi and Tanzania.
2013–ongoing
CRIDF is supports Malawian and Zambian institutions to implement water supply and sanitation projects on the utilities’ respective sides of the border town of Mchinji. This support consists of building boreholes, storage tanks and ablution blocks with toilets, bathing and laundry facilities for those crossing the border, and supplying water to 2,000 people in the local community. The project aims to provide sustainable and equitable access to a safe water supply and appropriate sanitation. This is particularly important for reducing the transmission of water-borne diseases across borders, which can stifle trade and other commercial and social activities within the region.
2016–2018
Chipata and Chanida are Zambian border towns – on the borders with Malawi and Mozambique respectively. The towns suffer from inadequate access to water, and sanitation facilities that can trigger the transmission of water-borne disease across borders, stifling commercial and social activities in the sub-region. CRIDF is constructing boreholes and ablution blocks including washing and toilet facilities, and running an awareness campaign on disease transmission and hazards. Improvements in both infrastructure and education have the potential to save many lives and the project will directly benefit around 3,000 people.
2015–2018
High-value tourism areas are found across Southern Africa. These are areas of high biodiversity and home to millions of poor rural people. A variety of income earning opportunities exist in relation to producing quality food in these areas. CRIDF identified opportunities for developing infrastructure to produce high-quality food and encourage local economic and agricultural development through linkages into local tourism related value chains. Such interventions increase climate resilience for the poor, support wealth creation and mitigate climate risks.
2015–2017
CRIDF has supported the Kavango–Zambezi Transfrontier Conservation Area Secretariat to identify livelihood interventions for more than 3,000 people. These interventions will alleviate water shortages, reduce incidences of human– wildlife conflict, and enhance people’s basic standard of living in Angola, Namibia, Zambia and Zimbabwe. Solar panels and wind turbines will power water infrastructure. Infrastructure construction has been completed at one site and funding applications prepared at other sites. The approach of working with KAZA TFCA has considerable potential for replication, expansion and scale up across the region in other Transfrontier Conservation Areas.
2014–2017
The Zambian government asked for CRIDF assistance in a feasibility assessment on the Sikauzwe Food Security Scheme, to build climate resilience for nearly 2,000 people along the Ngwezi River near Kazangula. CRIDF assessed potential opportunities for improving the scheme to attract financial backing from the World Bank under its existing loan to Zambia.
2014–201
CRIDF worked with Illovo Sugar (Malawi) and GIZ to upgrade the water supply system for Nchalo and meet the drinking water needs of up to 50,000 people. To support the project, CRIDF completed a feasibility study and provided technical inputs.
2014
CRIDF contributed to the preparation of the Kikonge Dam (for hydropower generation and water storage) and irrigation projects in the Ruhuhu River Basin. The projects aim to promote climate resilience, transboundary water management and pro-poor development through climate change risk assessment, international notification and a financing strategy. The Kikonge Dam will store 6 billion cubic metres of water and generate hydropower from the Ruhuhu River. It will not only make electricity supply more reliable to consumers, but will also contribute to flood control and improved water supply for local people and the proposed downstream irrigation scheme. The Ruhuhu irrigation project will command 4,000 hectares of irrigated land and benefit between 4,000 and 8,000 local households depending on how land is allocated. To fund these projects, a successful application has been made to the African Water Facility for a grant of £3.7 million.
2013–2017
The Chikowa Dam and Irrigation Scheme in Zambia will increase agricultural production and provide water security for local people. To help secure World Bank funding CRIDF undertook a feasibility study for the scheme.
2013–2017
The Sioma Irrigation Scheme will provide irrigation for 68.5 hectares of established crop land. As a pilot project to test ideas, CRIDF completed a feasibility study, and advised on technical improvements that would make the project more effective – such as providing more efficient irrigation systems. As part of a funding application to the World Bank, CRIDF also helped to develop a business case linking the irrigation scheme to potential markets.
2013–2016
The Chirundu Water and Sanitation Project provides long-term and fair access to safe water for approximately 20,000 people living on the Zambian border. CRIDF helped project planners to attract funding by completing a feasibility study for the project and engaging with prospective project financers.
2013–2016
The Mashili Dam irrigates more than 50 households farming over 10 hectares of land, and provides water for more than 6,000 head of livestock. CRIDF intervened directly to prevent the physical collapse of the infrastructure until upgrades could be made: this was seen as a relatively small input to save a valuable resource. Subsequently, CRIDF conducted a feasibility study to identify options for building climate resilience in the community around Mashili, such as providing water for livestock, fish farming and vegetable gardens. The aim was to improve viability and broker funding from the World Bank.
2013–2016
The value of ecosystem services provided by the natural environment in the Zambezi Basin has been described as astonishing. There are 13 designated Ramsar Convention on Wetlands sites of international importance within the Basin. The Mana Pools and Victoria Falls National Park/Mosi-oa-Tunya are also designated UNESCO World Heritage Sites.
Approximately 75% of the Basin population live in rural areas, varying from around 50% in Zambia to 85% in Malawi. Over 85% of the total population live in Malawi, Zambia and Zimbabwe. Mining, fisheries, agriculture, manufacturing and tourism are the major sources of income. Botswana has a relatively high GDP due to its diamond mining activities, which account for 85% of its export earnings. [9]
The hydropower plants in the Basin are important for industry but threaten ecosystems and traditional agricultural practices. [1,10] The total economic value of ecosystem services which provide resources for agriculture, livestock, tourism, fishing and domestic water supply in the delta area alone are estimated to be between US$930 million and US$1.6 billion. This is greater than the value of water for hydropower, without considering cultural and biodiversity values. [3]

The hydropower plants in the Basin are important for industry but threaten ecosystems and traditional agricultural practices. [1,10] The total economic value of ecosystem services which provide resources for agriculture, livestock, tourism, fishing and domestic water supply in the delta area alone are estimated to be between US$930 million and US$1.6 billion. This is greater than the value of water for hydropower, without considering cultural and biodiversity values. [3]
A large percentage of the Zambezi Basin population relies on subsistence agriculture. Traditional farming practices have been affected by hydropower dams, which prevent or alter the annual flooding of the plains that would otherwise add nutrients to the soil and dilute pollutants. [3]
Agricultural practices vary throughout the Basin according to the environmental conditions. In the Upper Zambezi Basin, traditional slash and burn practices are being abandoned in favour of settled practices as the population increases. The most productive agricultural areas are in the Angolan highlands and north-western Zambia, where farm sizes are the largest, averaging around 10 ha. Agriculture in the floodplains is intensively practiced in narrow zones between the floodplains and wooded areas with a typical farm size of 2–4 ha. Staple food is grown alongside fruit and vegetables. The main cash crops are tobacco, sugar and cotton. [10]
The Basin is extremely vulnerable to climate change. Most climate models are predicting a 0.3ºc–0.6ºc temperature increase per decade over the next century and a 10–15% decrease in rainfall by 2050. This will have negative repercussions on the future of hydropower, on which much of the Basin relies.[3]
The land areas used for subsistence agriculture are under threat from climate change as the amount of land suitable for rain-fed agriculture is decreasing. Large dams increase the vulnerability of these areas by changing the hydrology. Hydropower dams and the associated hydrology changes pose a socio-economic threat to prawn and freshwater fisheries, agriculture in the floodplains and river bank, water supply to the floodplains, and the ability of the area to support a rich wildlife community which attracts tourism. There are particular concerns for the Zambezi Delta area and other biodiversity hotspots including the Barotse Floodplain and the Lower Kafue River Basin. [3,7]
Water pollution from mining activities and agricultural run-off pose a threat to human health and ecosystems in the Basin. Degradation of ecosystem health reduces the economic value gained from fisheries, agriculture and ecosystem services such as provision of reeds for roofing materials.
There is likely to be increased competition between energy provision through hydropower and water supply for agriculture. Water is least available but most heavily in demand in the dry season. When water supply is limited, hydropower energy provision is usually given priority over water supply. [3]
[1] World Bank. The Zambezi River Basin. The Zambezi River Basin [Internet]. 2017;1. Available from: http://siteresources.worldbank.org/INTAFRICA/Resources/Zambezi_MSIOA_-_Vol_1_-_Summary_Report.pdf
[2] FAO. Irrigation potential in Africa: A basin approach. Chapter 6. [Internet]. 1997. Available from: http://www.fao.org/3/W4347E/w4347e0g.htm
[3] Beilfuss R. A Risky Climate for Southern African Hydro. Int Rivers, Berkely [Internet]. 2012; (February):1–46. Available from: http://climenews.com/letoltes/zambezi_climate_report_final.pdf
[4] Kirchhoff C, Bulkley J. Sustainable Water Management in the Zambezi River Basin. J Int Inst [Internet]. 2008;10. Available from: https://quod.lib.umich.edu/j/jii/4750978.0015.208/--sustainable-water-management-in-the-zambezi-river-basin?rgn=main;view=fulltext
[5] ZAMCOM. About ZAMCOM [Internet]. 2019. Available from: http://www.zambezicommission.org/about-zamcom/about-zamcom
[6] RAMSAR. RAMSAR Sites Information Service [Internet]. [cited 2019 May 17]. Available from: https://rsis.ramsar.org/ris-search/zambezi?pagetab=1
[7] World Bank. Zambezi River Basin Sustainable Agriculture Water Development [Internet]. 2008. Available from: http://www.the-eis.com/data/literature/Zambezi Irrigation Study.pdf
[8] Bwakali D. The Electrical Fish of Zambezi River [Internet]. 2018 [cited 2019 May 17]. Available from: https://environmentalafrica.com/index.php/en/rivers/item/97-the-electrical-fish-of-zambezi-river
[9] CIA. World factbook [Internet]. 2017. Available from: https://www.cia.gov/library/publications/resources/the-world-factbook/geos/sf.html
[10] World Bank. The Zambezi River Basin A Multi-Sector Investment Opportunities Analysis. Volume 3 - State of the Basin. Vol. 3. 2010.
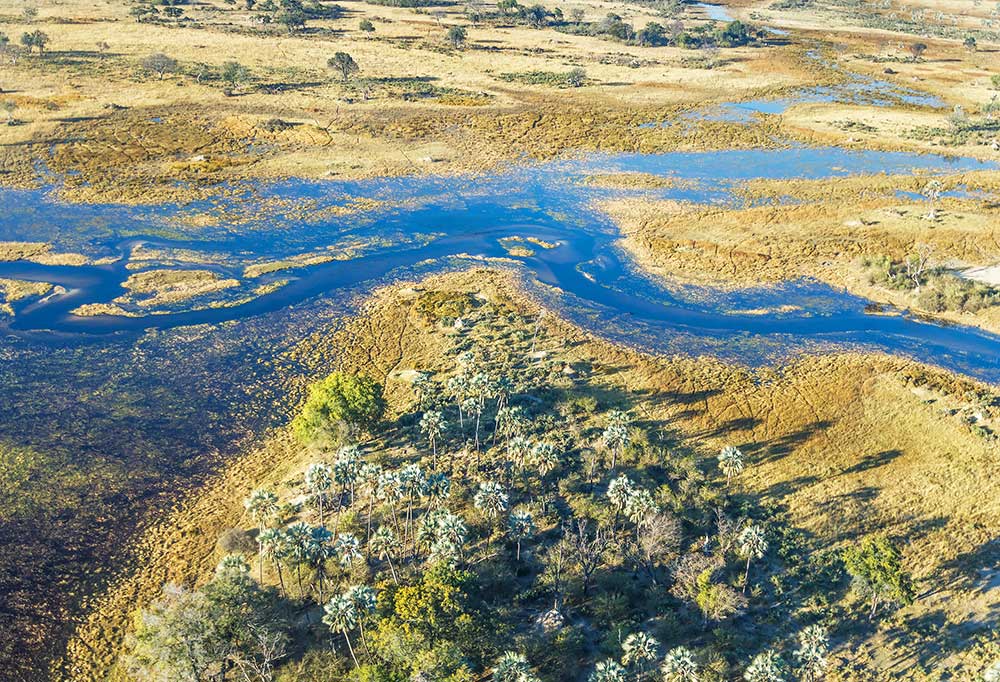
Countries: Angola, Botswana, Namibia
River Basin Commission: Permanent Okavango River Basin Water Commission (OKACOM)
Size: 700,000 km2
Population: 900,000 –1,600,000 [1,2]

The Cubango-Okavango Basin spans areas of Angola, Botswana and Namibia. The Basin covers over 700,000 km2, but the majority of its flow comes from 120,000 km2 in Angola, where the rivers Cuito and Cubango-Okavango originate in the highland plateau. Angola provides 94.5% of the total water runoff in the catchment. By the time the Okavango River reaches Botswana, it is roughly 200 m wide and 4 m deep. [2,3]
The population of the Basin was estimated in 2011 at 900,000, with approximately 505,000 in Angola, 158,000 in Botswana and 220,000 in Namibia. [1] This is expected to grow to between 1.15 million and 1.68 million by 2020. [1,2]
OKACOM was created by the member States of Angola, Botswana and Namibia in 1994, to determine how to develop the Basin for the benefit of the citizens of all three countries without degrading the river’s ecosystems. [8]
CRIDF is implementing a small-scale, 60-hectare agricultural scheme for the Mayana community (about 120 households near Rundu, Namibia). The current agricultural land utilised by the community is affected by annual flooding from the Okavango River. CRIDF provides agricultural input planning and is examining funding options with the Namibian authorities.
2013–ongoing
CRIDF is helping the Permanent Okavango River Basin Water Commission to develop and finance a livelihoods programme that will ensure water and food security for the rural poor, share data through the rehabilitation of river monitoring sites and reduce communities’ vulnerability to climate change.
2017–ongoing
CRIDF completed the preliminary design of water supply and sanitation projects to increase water security for more than 20,000 rural people in the Calai District. The Facility also provided advice on the institutional requirements for the operation of water infrastructure.
2014–2016
CRIDF works with the Permanent Okavango River Basin Water Commission and the World Bank to identify, assess, cost and develop a multi-sectoral portfolio of potential projects focused on livelihoods, socio-economic development, and water resources management. An OKACOM project identified areas for development including livelihoods, tourism institutions and major infrastructure such as hydropower, irrigation and water transfer. This work has also identified the benefits of transboundary collaboration.
2016–2017
In partnership with OKACOM, CRIDF developed a methodology to assess and select programmes of water-related development projects to help reduce tensions between Basin development and climate resilience. If climate resilience is integrated into planning objectives and programme identification, then the projects that emerge from that process are more likely to be inherently climate resilient.
2016–2017
CRIDF helped OKACOM develop a common vision for the sustainable and equitable development of the Okavango River Basin, supporting economic growth and poverty eradication in each of its member states. This project also updated communication products, repackaged existing and new data into new products and supported key events with products and displays.
2013–2016
High-value tourism areas are found across Southern Africa. These are areas of high biodiversity and home to millions of poor rural people, leading to tension between groups in accessing and using water resources. Proposing strategies to reduce this tension, CRIDF identified opportunities for developing infrastructure to produce high-quality food and encourage local economic and agricultural development as well as promoting tourism.
2015–2017
CRIDF completed the preliminary design of water supply and sanitation projects to ensure water security for more than 20,000 rural people in the Calai District.
2014–2016
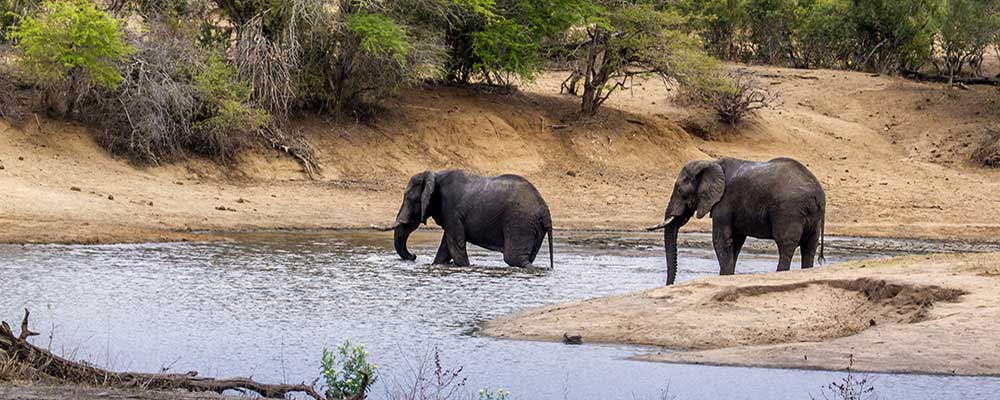
The Cubango-Okavango is one of the last aquatic ecosystems in Africa, and on earth, to be in almost pristine condition. The 68,640 km2 Okavango Delta wetlands site is the world’s third largest Ramsar Convention on Wetlands site and contains over 150,000 small islands. [2,3] The Okavango Delta System fulfils 6 of the 9 Ramsar designation criterion. Wildlife in the area includes the endangered grey crowned crane and the vulnerable African elephant, hippopotamus, lion, lappet-faced vulture, slaty egret and thite-headed vulture. [5]
The population of the Cubango-Okavango Basin is mostly rural and experiences a higher degree of poverty than the national average in each of the three countries. In Namibia, the Kavango Region (national spelling) has 57% of households classified as poor and 36% as severely poor, compared to a national average of 28% and 14% respectively. The Basin population is also considered to be less healthy and less educated than other parts of each country.
There is a high level of ethnic diversity in the Basin including Bantu and non-Bantu groups.
Despite the majority of land and water supply to the Cubango-Okavango Basin coming from Angola, Angola receives little direct economic value in comparison to the downstream countries of Namibia and Botswana.

N.B. The vast non-direct benefits such as provision of clean water, educational value, flood prevention are not included here and have not been well studied in this region. Extractive value includes goods such as fish and reeds which are taken for direct use.
In Namibia the population density in the Basin is much higher than the rest of the country. Ninety-four percent of Namibia’s Basin population lives within five km of the river.
The per capita GDP of Angola, at US$52,237, is several times greater than those of Botswana (US$10,798) and Namibia (US$7,410). Angola’s primary source of income is from oil, accounting for 44.5% of the GDP. However, Angola has the lowest GDP per capita and falls behind the other countries in terms of the Human Poverty Index, where it scores 89% in comparison to 25–30% for Botswana and Namibia. [1]
The Cubango-Okavango Basin is largely dominated by traditional practices such as rain-fed subsistence agriculture. [7] Areas of irrigated industrial agriculture in the Basin are 2,200 ha in Namibia , 1,100 ha in Angola, and 31 ha in Botswana. [7] There are plans for large increases in cultivation in Basin areas of Namibia and Angola which will affect the river flow. All three countries have policies to expand agriculture for higher levels of food security, with Namibia aiming for a four-fold increase in irrigated agriculture. [1]
Agricultural chemicals and fertilizers are not commonly used and there is little use of compost or organic manures. Crop productivity is generally very low, except in northern areas of the Basin where it is considerably higher. [1]
Traditional forms of recessional agriculture such as the molapo system in Botswana and the olonaka system in Angola are used, although Namibia has no such system. This type of farming occurs close to rivers and streams and is more productive than dryland agriculture, as soil fertility and moisture is maintained by seasonal flooding. [1]
Climate change will lead to increased temperatures and decreased rainfall across the Basin, though some regions will be more negatively affected than others. Increased peak river flow is likely to lead to inundated settlements and farmland during the rainy season. [3]
Urbanisation will lead to an increased demand on water and sanitation and reduce vegetation cover in the local vicinity. This could lead to pollution from waste disposal, reduce the flow of the river and change siltation patterns. [1]
Pesticides and other persistent organic pollutants that may be used in increasing amounts in these systems could enter the river with unknown consequences for the ecosystem and people who extract water and other resources from it. [1]
As more land is claimed for agriculture and livestock, conflicts between humans and wildlife may grow. Renewed conflicts between humans and elephants have already been reported. Increased human demand for land may also reduce the diversity and productivity of the river system. The increasing price of food imports puts even more demand on locally grown food to ensure food security. [1]
Increases in tourism demand an increase in infrastructure such as hotels and associated waste, which puts pressure on the natural systems being visited. [1]
Developing the Basin’s agriculture will benefit Angola but have adverse effects on Botswana by decreasing the desirability of tourism, which is estimated to be worth over US$400 million per annum. Angola does not benefit from tourism. [1]
[1] Cubango-Okavango River Basin Transboundary Diagnostic Analysis http://www.okacom.org/site-documents/tda-final-reports/feffcubango-okavango-river-basin-transboundary-diagnostic-analysis, Accessed 26 April 2019
[2] OKACOM Fact Sheet for the Cubango-Okavango http://www.okacom.org/okavango-fact-sheet, Accessed 26 April 2019
[3] OKACOM Knowing the River: Okavango Countries http://www.okacom.org/knowing-the-river/okavango-countries, Accessed 26 April 2019
[4] RAMSAR news: Okavango Delta Ramsar Site is now 1000th World Heritage Site https://www.ramsar.org/news/okavango-delta-ramsar-site-is-now-1000th-world-heritage-site-0
[5] Information Sheet on Ramsar Wetlands (RIS) 2009-2014 version: Bwabwata – Okavango Ramsar Site https://rsis.ramsar.org/RISapp/files/RISrep/NA2193RIS.pdf
[6] : Information Sheet on Ramsar Wetlands (RIS) 2009-2014 version: The Okavango Delta System https://rsis.ramsar.org/RISapp/files/RISrep/BW879RIS.pdf
[7] The Future Okavango: Findings, Scenarios, and Recommendations for Action http://www.future-okavango.org/downloads/TFO_Report_engl_compiled_small_version.pdf, Accessed 29 April 2019
[8] Integrated management of the Cubango-Okavango River Basin https://www.researchgate.net/publication/308943575_Integrated_management_of_the_Cubango-Okavango_River_Basin, Accessed 29 April 2019
Countries: Botswana, Lesotho, Namibia, South Africa
River Basin Commission: Orange-Senqu River Commission (ORASECOM)
Size: 900,000 km2
Length of main river: 2,300 km
Population: Over 20 million [1]

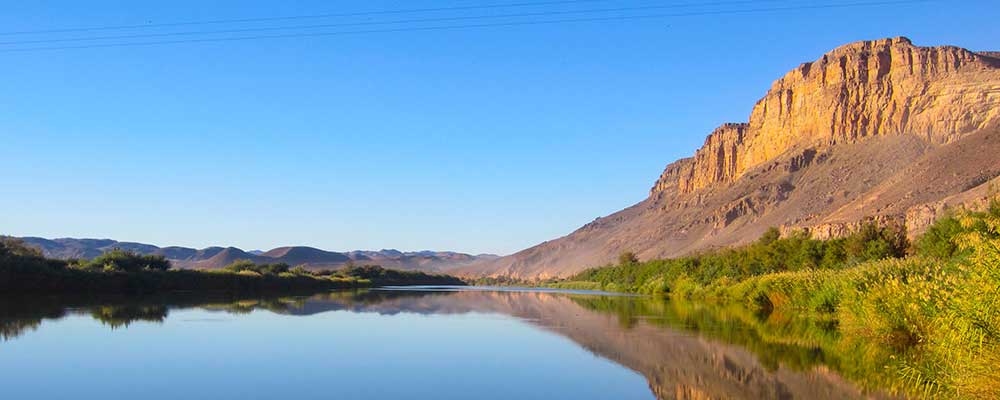
The Orange-Senqu River Basin covers the entire area of Lesotho, a large part of South Africa, and southern areas of Botswana and Namibia. Over 95% of the water in the Basin is supplied by Lesotho and South Africa. The Senqu River flows from its source at 3,300 m in the Lesotho highlands and becomes the Orange River at Lesotho’s border. It forms the southern border of Namibia and eventually enters the Atlantic Ocean. [2,3,4]
It is the most developed trans-boundary river basin in the Southern African Development Community, containing many industrial areas of Southern Africa. The Basin is well-engineered with several storage dams and transfer schemes to distribute water between industrial use and agricultural use. ORASECOM’s management of the water resources covers issues such as water quality, supply and pollution control. [2,4]
CRIDF is helping the Orange-Senqu River Commission (ORASECOM) to integrate climate resilience into the planning and development of its water infrastructure. This will ensure water and food security for the rural poor, and in so doing reduce vulnerability to climate change.
Six main geographical regions cover the Orange-Senqu River Basin. These are:
There are five Ramsar Convention on Wetlands sites of international importance in the Orange-Senqu River Basin.
Ramsar site |
Country |
Features |
Orange River Mouth |
Namibia and South Africa |
The only perennial river in this dry region creates a landscape of islands, saltmarshes, freshwater lagoons, marshes, sand banks and reedbeds. These provide habitat for several endemic plants and bird species. |
Barberspan |
South Africa |
A permanent, natural freshwater lake supporting 10 fish species and a rich plankton community. It is important for breeding birds and migrant birds. |
Seekoeivlei Nature Reserve |
South Africa |
A world-famous sanctuary containing a large inland wetland with lakes, marshes, floodplains, pools and peatland, providing habitats for several species of endangered birds and mammals. |
Blesbokspruit |
South Africa |
One of the few permanent water bodies in the area. It is seasonally important for migrant bird and mammals. |
Natal Drakensberg Park |
South Africa |
A rugged wilderness area over three altitudinal zones bordering Lesotho and South Africa. It is the catchment area of three major rivers. The wetland system is in almost pristine condition, supporting several endangered and endemic plant and animal species. |
The Orange-Senqu River Basin is home to over 20 million people. Most of this population resides in South Africa (85%) and Lesotho (13%). The northern and western parts of the Basin are sparsely populated.
There is a considerable difference between the economies of the four countries. The relatively high per capita GDP of Botswana is partially due to its diamond mining activities.

South Africa is the biggest water user of the Orange-Senqu Basin, accounting for 97% of total water use in the Basin. Namibia accounts for 2%, Lesotho 1%, and Botswana less than 1%. [3]
Climate change poses a major risk to the Orange-Senqu Basin. Increased temperatures and changes in rainfall patterns will affect water supply, farmland and wetlands. This, in turn, will cause knock-on negative effects to food security and rural incomes. [2]
Most degradation is due to population increase and limited land resources. Small-scale farmers often over-graze land with livestock, clear forests, and plant crops on steep slopes.
Less than half of the natural annual flow of the river of 11,300 cubic megametres reaches the river mouth. Extraction rates are increasing due to inefficient use, poor quality infrastructure and a lack of understanding of the value of water.
Nutrient loads from agricultural run-off and pollution from mining, industry and urban areas contribute to the deteriorating water quality in the Basin, with reduced volume leading to an increase in concentration of pollutants. This increase poses increases risks to health.
Increases in water extraction, dams, sedimentation from land degradation and invasion of alien species all contribute to changes in the hydrology of the river. Effects of increased sedimentation include the loss of the natural ability of highland areas to store water during heavy rainfall, leading to increases in soil erosion and the occurrence of flooding downstream. [7]
All of these factors affect the ecosystems in the area. Nature-rich areas of the basin such as the Orange River Mouth have deteriorated due to pollution from nearby diamond mining and dam building that has affected the flow of the river. [8]
[1] ORASECOM. Socio-economics in the Basin [Internet]. [cited 2019 Jun 5]. Available from: http://www.orangesenqurak.com/people/socioeconomics/Socio-Economic+Entity.aspx
[2] ORASECOM. Orange-Senqu River Awareness Kit - Geography [Internet]. [cited 2019 Jun 5]. Available from: http://www.orangesenqurak.com/river/Geography.aspx
[3] Lange GM, Mungatana E, Hassan R. Water accounting for the Orange River Basin: An economic perspective on managing a transboundary resource. Ecol Econ. 2007;61(4):660–70.
[4] World Resources Institute. Orange-Senqu River Basin Study [Internet]. Available from: https://www.wri.org/resources/data-sets/orange-senqu-river-basin-study
[5] CIA. World factbook [Internet]. 2017. Available from: https://www.cia.gov/library/publications/resources/the-world-factbook/geos/sf.html
[6] ORASECOM. Orange-Senqu: Water demand in the basin [Internet]. [cited 2019 Jun 10]. Available from: http://orangesenqurak.com/challenge/water+demand/wdosrb.aspx
[7] UNDP–GEF Orange–Senqu Strategic Action Programme. Strategic Action Programme for the Orange-Senqu River Basin. 2014;52.
[8] Ramsar Convention Secretariat. Annotated List of Wetlands of International Importance: South Africa. 2011;4–7. Available from: https://rsis.ramsar.org/sites/default/files/rsiswp_search/exports/Ramsar-Sites-annotated-summary-Indonesia.pdf?1523278323
Countries: Botswana, Mozambique, South Africa, Zimbabwe
River Basin Commission: Limpopo Watercourse Commission (LIMCOM)
Size: 408,000 km2
Length of main river: 1,750 km
Population: 14–18 million [1,2]

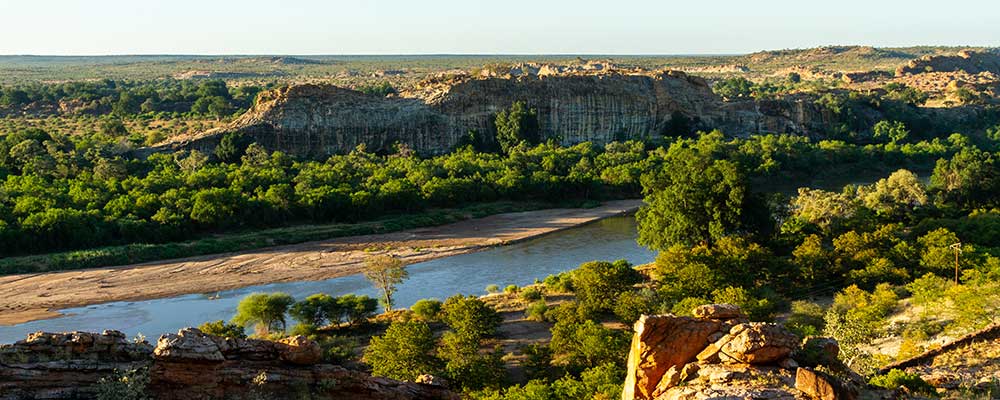
The Limpopo River has its headwaters near the border of Botswana and South Africa, from where it flows between the border of the two countries before forming the border between South Africa and Zimbabwe. Finally, it flows through Mozambique and enters the Indian Ocean near the city of Xai-Xai. [3]
The annual rainfall in the Basin varies between 200 mm and 1,500 mm, with the northern and western parts being the driest. In dry years the upper section of the river only flows for 40 days. Approximately 95% of the rainfall falls between October and April. Flooding is a typical problem in Mozambique, while drought affects other areas of the Basin. [1,4,5]
The Limpopo River Basin is categorised as “closed”, which means it has no more resources left to allocate. [2]
In its support of the Limpopo Watercourse Commission (LIMCOM) strategy, CRIDF is helping LIMCOM to integrate climate resilience into the planning and development of water infrastructure. This support includes the development and potential financing of a livelihoods programme ensuring water and food security for the rural poor and increasing their resilience to climate change.
2017–ongoing
CRIDF is working with the Mozambique and other stakeholders to develop innovative approaches to finance the development and operation of water infrastructure. This includes water users from the private sector funding the operation of monitoring and flood warning systems in the Incomati and Limpopo Basins. Another approach is accessing international funding to improve flood management infrastructure in the Lower Incomati – an initiative that will benefit at least 250,000 people.
2017–ongoing
Small-scale farmers in Matabeleland, Zimbabwe struggle with erratic rainfall, which results in the failure of rainfed agriculture. Small dams play a crucial role in small-scale irrigation, livestock watering and water supply, but few new dams have been constructed since 2000 and existing dams have not been well maintained. CRIDF is working closely with the East Limpopo Joint Venture to prioritise dam sites, and design and enhance infrastructure at five locations, benefitting more than 20,000 people, improving their water security and livelihoods.
2013–ongoing
In association with LIMCOM, and partnering with the private sector, CRIDF implemented a real-time transboundary system to monitor river flow. Through this initiative and through improved cross-border cooperation, an early warning flood forecasting system for the Limpopo Basin has benefitted 600,000 poor people who live on the Limpopo floodplain.
2013–2017
There are three Ramsar Convention on Wetlands sites of international importance within the Limpopo Basin. All three sites fall within South Africa. [6]
The Basin has an extremely high level of biodiversity. Management proposals to protect the Basin’s population from flooding and drought and to protect the industrial economy by maintaining a reliable water source include repairing and maintaining the natural environment. Upstream high-altitude biodiversity hotspots which have high rainfall and regulate the flow of water are considered particularly important. [2]
Poverty is widespread within the Basin. The rural population of Mozambique has the highest level of rural poverty at 38%. Many do not have access to sanitation and water supplies are either limited or polluted. [1]
Industries including mining are a major source of income for some of the Basin countries. These industries, plus irrigated agriculture, require a large amount of water in a system where no more water is available to allocate.
A large proportion of the Basin’s population rely on erratic rainfall for irrigation, which has wider implications for urban populations relying on food from these markets. Farmers are now being advised to increase their resilience to drought by simple techniques such as rainwater harvesting from roofs and better soil management.
Most of the Basin is considered to be water scarce. One of the key threats to the Basin is increased levels of drought due to climate change and increasing competition for water. Climate change is expected to have a greater impact in arid areas than most other areas. Other effects of climate change include increased variability in rainfall, increased temperatures and increased severity of floods.
There are plans to extend the mining industries in the Basin countries, increasing water demand, despite there being no more water left to allocate. Legally, each company making commercial use of water should apply to the National Department of Water Affairs for a license. In reality, mines and other industries are extracting water without permits. In 2010, 125 mines in South Africa alone were operating without a licence.
In areas which have irrigated agriculture, the water available for irrigation may decrease or become unavailable. This poses a problem for food security in the area. [1,2,5]
[1] CGIAR. Summary of CPWF Research in the Limpopo River Basin.
[2] Petrie A, Chapman B, Midgley R, Parker A. Risk , Vulnerability & Resilience in the Limpopo River Basin. 2014.
[3] World Meteorological Institute. Limpopo river basin proposal: A proposal to improve the flood forecasting and early warning system. 2012;1–62.
[4] GIZ. Geography of the Limpopo River Basin [Internet]. Available from: http://www.limpopo.riverawarenesskit.org/LIMPOPORAK_COM/EN/RIVER/GEOGRAPHY.HTM
[5] Global Water Partnership. Limpopo basin [Internet]. Available from: https://www.gwp.org/en/WACDEP/IMPLEMENTATION/Where/Limpopo/
[6] Ramsar Convention Secretariat. Annotated List of Wetlands of International Importance: South Africa. 2011;4–7. Available from: https://rsis.ramsar.org/sites/default/files/rsiswp_search/exports/Ramsar-Sites-annotated-summary-Indonesia.pdf?1523278323
Countries: Malawi, Mozambique, Tanzania
River Basin Commission: Upper Ruvuma Catchment Basin Steering Committee (URCBSC) [1] and Joint Water Commission (JWC) [2]
Size: 155,000 km2 [3]
Length of main river: 800 km [4]
Population: 2.4 million [5]
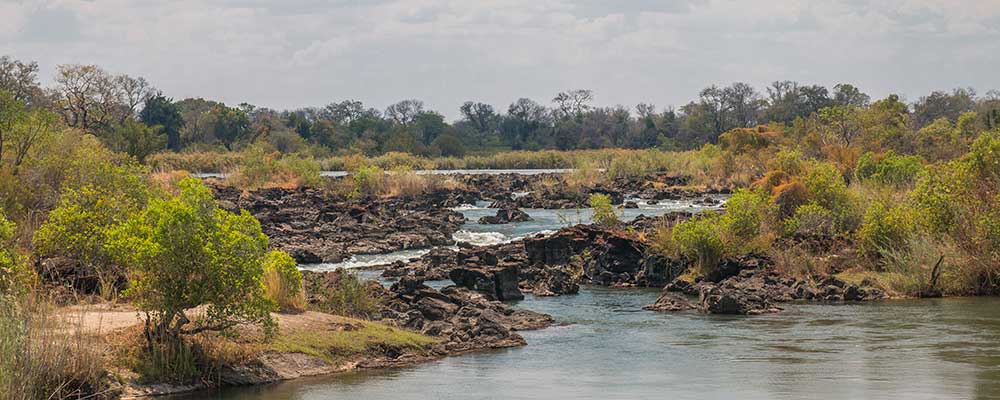
The Ruvuma River, previously known at the Rovuma, is approximately 800 km long and separates the countries of Tanzania and Mozambique for most of its length. [5] It is surrounded by otherwise dry regions; so plays a vital role in providing water to people and wildlife in the region. [4]
The Upper Ruvuma Catchment Basin Steering Committee (URCBSC) aims to “find a sustainable solution for all water users”, [5] while the mandate of the Joint Water Commission (JWC) of the governments of Mozambique and Tanzania similarly seeks to ensure “sustainable development and equitable utilisation of common water resources of the Rovuma/Ruvuma River Basin”. [c.f. 2]

In Mozambique two major tributaries feed the Ruvuma River, the Lucheringo and Lugenda Rivers. [4] The latter comprises a major part of the Ruvuma Basin. Major tributaries on the Tanzanian side are the Likonde, Muhuwesi and Lumesule.
The Ruvuma Basin is very scarcely populated. Settlements are mainly concentrated to the southwest in the Lichinga area, and along the main roads in the south (Lichinga to Pemba and Lichinga to Cuambe) and north (Mtwara to Songea). No major dams or hydraulic infrastructure exist in the Basin.
The central part of the Ruvuma is pristine, bordered by large protected areas in Mozambique and Tanzania, with the large Niassa Game Reserve a major feature. The areas around the river are predominately woodland, and wildlife surveys along the river’s edge have revealed large numbers of birds and mammals including hippopotamuses, waterbucks, buffalo, monkeys, baboons, otters and elephants. [6]
Major industries including mining, agriculture, livestock-rearing and power production, make use of water from the river. [5,7] The region is an important food production area, with high soil fertility and readily available water for growing crops. Households rely on the river for domestic use such as washing. Increasingly, the area is also attracting pastoralists who come to graze their herds of cattle. [4]
Ruvuma is one of four significant regions for producing food in Tanzania. Farmers cultivate staple crops including rice and maize. Pastoralists use the land to graze their animals, contributing to the availability of meat in the region. [6]
The Basin is under increasing pressure as more people come to depend on its resources. While the limited availability of historical or publicly available data for the Ruvuma River make it difficult to quantitatively track the health of the river against rising use, [2] there are nonetheless concerns that the increased demand for water is exceeding what is available. The river’s flow is reportedly diminishing as agricultural production and development expand, alongside increasing deforestation and soil loss. [7]
Pollution from both domestic (sanitation and solid waste management) and industrial (agriculture and artisanal mining) waste is a major problem for water quality in the Ruvuma River. [7,2] Saline intrusion is also diminishing water quality, with conditions expected to worse over the coming years. [7] Climate change is also likely to contribute to a decrease in the reliability of water resources.
The reduced availability of water resources from the Ruvuma River is already leading to conflicts between different water users, [5] and there is a need for better resource management in the future. River and surrounding forest management thus far has been hampered by several issues including low coordination between stakeholders, a shortage of manpower and skills, limited legal implementation and enforcement, low accountability, and different cultural practices of river users. [4]
[1] Water Action Hub. Upper Ruvuma Catchment Basin Steering Committee [Internet]. Available from: https://wateractionhub.org/projects/165/d/upper-ruvuma-catchment-basin-steering-committee
[2] Minihane MR. Evaluation of streamflow estimates for the Rovuma River. Physics and Chemistry of the Earth Parts A/B/C. 2012;50:14–23
[3] SGS. Alliance for Water Stewardship Assessment Report. Prepared for Aviv Tanzania. 2016. Available from: https://a4ws.org/wp-content/uploads/2017/01/Olam-Approved-Report-1116.pdf
[4] Ecological Initiatives. The Ruvuma: Expedition Report, May 2015. Available from: http://www.alessandrasoresina.com/allegati/progetti/ruvuma_report.pdf
[5] ICLEI. Sustainable River-based Urban Planning for Sub-Saharan Africa: Case Studies. 2018. Available from: http://cbc.iclei.org/wp-content/uploads/2018/06/UNA-Rivers-Case-Studies.pdf
[6] Giliard S, Thomas L. Ruvuma River Basin & Life of Ordinary People. Inter Press Service Africa. 2013. Available from: http://photocup.weebly.com/uploads/4/5/2/6/4526871/ruvuma_river_basin.pdf
[7] IWaSP. Where we work: Tanzania [Internet]. 2016. Available from: http://www.iwasp.org/where-we-work/where-we-work/tanzania
Countries: Mozambique and Zimbabwe
River Basin Commission: Joint Water Commission for the Buzi, Save and Pungwe River Basins
Size: 31,150 km2 [Zimbabwe 1,463 km2; Mozambique 29,687 km2]
Population: 1.6 million [1]
The Pungwe Basin is situated almost entirely in Mozambique, with less than 5% of the area across the border in Zimbabwe. The Pungwe River flows through the middle, from the Inyangani mountains in Zimbabwe out to the Indian Ocean at the Mozambique coastline. The river is fed by the principal tributaries in Zimbabwe of the Honde on the right bank and the Nyazengu, Chiteme, Nyamhingura, Nyawamba, Nyamukombe, and Rwera rivers on the left bank. [2]
In general, settlements in the Pungwe River Basin consist of rural village communities, a few scattered small urban centres, growth points, commercial farms and estates. These are concentrated along the river valleys, in the flood plains, along main roads, and around administrative centres. The port city of Beira on the coast is the main urban and industrial centre in the basin. Projected population estimates predict two million people living in the basin by 2023. [2]
In Zimbabwe, the basin area is a combination of national park, exotic forest plantations in the upstream reaches, and mixed agriculture in the middle and lower valleys. The Nyamukwarara River, a tributary of the Honde, drains some alluvial gold mining and panning areas in both Zimbabwe and Mozambique, where it collects a large quantity of sediment that remains visible along the river beyond Tete Bridge in Mozambique. The Pungwe flows through mixed farmlands, passing along the southern border of the Gorongosa National Park (GNP), where it enters the floodplain, and finally into the intertidal zone of the Pungwe estuary. It then flows into the Indian Ocean at Beira Port. [2]
Across the Basin, average minimum temperatures range from 22oC in the coastal areas to 9.9oC in the higher areas of Inyangani Mountain range. The higher altitudes in the mountainous region at the River’s source see that area record among the lowest temperatures in Zimbabwe.
The area, in particular the lower eastern area of the Basin, is particularly vulnerable to flooding in the rainy season. The flood waters, while causing huge damage to infrastructure and disruption to the local people, also serve to reinvigorate the land by redistributing nutrients on which the local ecosystem depends. [2]
More than half the rural population live below the poverty line, with populations growing despite the impact of the HIV/AIDS epidemic, keeping average life expectancy across Mozambique extremely low. [1]
The existing culture of transboundary cooperation [1] means that relations between Mozambique and Zimbabwe are good. As is the case for all river routes in Mozambique, the rivers always flow downstream to Mozambique, with the sources in Zimbabwe.
The total surface water resources of the Pungwe River are estimated to about four billion m3 per year. Future estimated water demand in 2025 comprises only one fifth of the available resource, leaving wide scope for potential development. In the floodplain, below the Bue Maria dam site, there is a huge potential for agricultural development due to the occurrence of fertile soils and the possibility of a major dam on the Pungwe River. In addition, the ongoing rehabilitation of eco-tourism in Gorongosa National Park and adjoining areas has the potential to create favourable conditions for economic development in the basin. [2]
Gorongosa National Park seems to be a local success story. Its animal population was seriously depleted due to civil war, but is now thriving, home to over 100,000 large animals and an important site for sustainable tourism, attracting international visitors. [3]
As well as eco-tourism, goldmining also plays a part in the local economy in both Zimbabwe and Mozambique. [4] However, mining activity is contributing to blocking light in the rivers with eroded soil, damaging the ecosystem and polluting drinking water.
Agriculture plays a large part in the local economy. Farming includes crop and livestock production, forestry and fisheries as well as sugar production. The agricultural practices are a mixture of subsistence dry land and irrigated crop farming. In 2008 water in the area was predominantly used for irrigation (at 84%) with 10% urban use; and the rest for livestock, industry and tourism and forestry. Projections forward to 2025 foresaw the biggest expansion of water usage in the forestry industry, up 400 % to 8% of the total. [4]
Beira is a hub of economic activity in the region. One of Mozambique’s three main processing and preserving facilities for seafood products is located in the port, in addition, there town is also home to large-scale processing plants for food crops such as maize. [5] Food storage capacity in the country is estimated at 560,735 tonnes, of which 95,000 tonnes is located in warehousing in this major port. [5] Fisheries operating out of Beira sell the majority of their catch into the European market. [5] A 2014 report predicts that 190,000 ha of irrigated agriculture could be developed in the Beira region. Irrigation for this development is likely to be in the ARA-Centro district. An increase in water use by FIPAG (Water Supply Investments and Assets Fund) Beira and the sugar estate Mafambisse is expected along the river Pungwe. These developments are likely to result in an increase in water demand of 10-20% per year, a trend that is expected to continue. [6]
Projections expect annual rainfall in 2050 to be reduced by approximately 10%; with increasing fluctuations of rainfall during the year and delays to the start of the rainy season. This drop in rainfall would worsen the already critical situation for water resources, in particular exacerbating floods and droughts in the area. [7]
Improper land use practices, in particular gold mining and panning along the river, result in water pollution [1]. The impact on the river from gold mining activities in the upper catchment is a major problem affecting water quality in the Pungwe River. Excavation for gold mining loosens the soil, leading to its erosion during the rainy season. The operation also strips the protective vegetation cover, thus creating conditions for further erosion and degradation of arable land, well after the mining site has been abandoned. [2]
The eroded soil becomes a suspended sediment, which leaves the water unsuitable for drinking, washing and irrigation. The suspension blocks the penetration of light into the water, reducing the efficiency of photosynthesis. Fish species that are sensitive to sediment-laden waters are also affected. [2]
[1] Sakupwanya, J and Malekane M. The Pungwe, Buzi and Save (Pubusa) and Central Zambezi Basins Portfolio. CRIDF. 2014 (June).
[2] Government of the Republic of Mozambique and Government of the Republic of Zimbabwe. A Monograph of the Pungwe River Basin [Internet], 2006 (November) Available at: http://www.eisourcebook.org/cms/Feb%202013/Pungwe%20River%20Basin,%20IWRM%20%26%20ASM.pdf
[3] Quammen, D. Devastated by war this African park’s wildlife is now thriving. National Geographic. [Internet], 13 December 2018 Available at: https://www.nationalgeographic.com/animals/2018/12/african-wildlife-is-rebounding-gorongosa-national-park/
[4] SIDA and Cap-Net. Case study: Pungwe River Basin in Mozambique. Training material in Integrated Water Resources Management for River Basin Organisations, Final Report. SWECO International. [Internet], 2008 (September) Available at: https://www.gwp.org/globalassets/global/toolbox/case-studies/africa/transboundary.-iwrm-implementation-at-pungwe-river-basin-in-zimbabwe-and-mozambique-333.pdf
[5] Chilonda, P, Xavier, V, Luciano, L et al. Monitoring Agriculture Sector Performance, Growth and Poverty Trends in Mozambique. Mozambique Ministry of Agriculture (MINAG) Directorate of Economics Mozambique SAKSS (MozSAKSS) [Internet], 2011 (December) Available at: https://www.resakss.org/sites/default/files/pdfs/MozSAKSS_ATOR_2010.pdf
[6] Droogers, P and Terink W. Water Allocation Planning in Pungwe Basin Mozambique. Future Water. [Internet], 2014 (July) Available at: https://www.futurewater.eu/wp-content/uploads/2014/10/Pungwe_WEAP_v05.pdf
[7] Andersson, L, Samuelsson, P and Kjellström, E. Assessment of Climate Change Impact on Water Resources in the Pungwe River Basin, Journal of Flood Risk Management. 2011;63(1):138–157.
Countries: Mozambique, Zimbabwe
River Basin Commission: Mozambique and Zimbabwe Joint Water Commission
Size: 31,000 km2
Length of main river: 250 km
Population: Over 1.2 million [2]

The Buzi River, or Rio Búzi in Portuguese, flows 250 kilometres from Zimbabwe through Mozambique’s Manica and Sofala provinces, draining a Basin of 31,000 km2 into the Mozambique Channel west of the city of Beira. During floods its mouth can form a large floodplain that meets the nearby Pungwe River, as happened catastrophically with the landfall of Cyclone Idai in 2019.
In the section of the Basin lying in Zimbabwe, water planning and bulk supply are the responsibilities of the parastatal Zimbabwe National Water Authority (ZINWA). ZINWA manages water resources with stakeholders in the catchment through the locally devolved management and enforcement of elected Catchment Councils. Mozambique’s ARA-Centro, meanwhile, is the Regional Water Administration for the Buzi, Save and Pungwe Basins in the country’s central belt, also facilitating stakeholder participation through River Basin Management Units and Committees. At the national level, a Joint Water Commission between Mozambique and Zimbabwe has been formed as a common platform for the development of shared water resources. [2]
The Buzi River originates south of Mutare, in Zimbabwe’s eastern mountains. From an altitude above 3,000 m in Zimbabwe it descends to 1,500 m in Mozambique. These western, highland parts of the Basin are temperate and humid, with mean annual precipitation of around 1,200-1,300 mm that falls mostly between November and April.
The Buzi River has two tributaries, the Revue flowing from the north and Lucite from the west. Combined, these form 374 km of total river length in Mozambique and 20 km in Zimbabwe.
Cascading to the coastal plains of Mozambique, the river and its tributaries enter a flat landscape of clay soils and low vegetation. The Buzi becomes strongly meandering on these broad floodplains. Here rainfall is lower at 900 mm per year, with mean annual evaporation of 1,300–1,400 mm. This makes rainfed agriculture challenging, with typically only one harvest possible per year. [3]
The seasonal water regime and flat landscape of the coastal plain causes frequent overflows that change the meandering course of the Buzi. Eventually it reaches an estuary on the Indian Ocean, which receives 2,500 million m3 of water in an average year. [1]
Some 1.2 million people live in the Buzi Basin, a number that is rising rapidly and projected to hit 1.9 million by 2030. [2] Most of these people live in the eastern, lowland and coastal areas, the part of the Basin in Mozambique. The majority are smallholder farmers who depend on rainfed agriculture.
There are only three large towns in the Basin: Vila do Búzi, Vila de Manica, and Chimoio, the capital of Manica Province. However, Mozambique’s second largest city, the major port of Beira, sits just 25 km from the mouth of the Buzi River, and is therefore very much influenced by its flow.
The Basin is also important to Mozambique’s energy supply, with two major dams generating hydropower on the upper Revue tributary. The Chicâmba Dam can hold 450 million m3 of water and generate an installed capacity of 38 MW. Just downstream, the Mavuzi Dam generates up to 52 MW of power. [1]
Agriculture in the highland and lowland areas of the Basin extends to bananas, beans, vegetables, forestry and tea growing [2]. However, maize is the major staple grown throughout the dry coastal plains. Current yields of this staple are well below 1 t/ha, generally below the level needed for food security.
Maize farming households and communities are highly vulnerable to changes in rainfall and to floods. After floods, which happen on a near-annual basis in the floodplain of the Basin, it is common for high temperatures and evaporation rates to stress maize and other crops and exacerbate crop failure. With worsening climate variability, even diversified livelihood systems that incorporate livestock are expected to become more vulnerable, as the natural processes that sustain fodder production also come under threat. [2]
Floods occur almost every year on the Buzi Basin’s large floodplain, causing varying degrees of harm to farming activities. The most extreme flooding yet recorded was brought by Cyclone Idai in March 2019. The UN World Food Programme reported “inland oceans extending for miles and miles”, with flooding of up to six metres leaving thousands of people stranded on rooftops and in trees. [4] There were more than 400 deaths, and more than half a million farming households were affected by the flooding of a reported 715,378 ha of fields – 13% of Mozambique’s agricultural land – adding up to crop losses of US$141-258 million. [5]
Outside of the flooding that typifies the rainy season, the coastal plain is also susceptible to water scarcity that endangers food security. Climate projections for the Basin’s two countries suggest that rainfall will decrease by 2–11% in Mozambique and 5–20% in Zimbabwe, which will combine with higher temperatures and evaporation to make farming much more risky and difficult. [2]
The Buzi River is moderately polluted with fertilisers, pesticides and herbicides, which are now being used on both small- and large-scale farms in the Basin. These sources of pollution are likely to grow over time. The wider Basin environment is also being degraded by a combination of deforestation, stream bank cultivation, and unregulated alluvial mining, all of which also contribute to water pollution and sedimentation. [2]
[1] Nakayama M. International Waters in Southern Africa. United Nations University Press. 2014.
[2] CRIDF. Green Climate Fund: Buzi River Basin Climate Resilience Fund Project concept note. 2015. Available from: http://cridf.net/RC/publications/green-climate-fund-buzi-river-basin-climate-resilience-fund-project-concept-note/
[3] Bustillos Ardaya A. Flood forecasting modeling for the Búzi River Basin in Mozambique. Masters thesis for the Cologne University of Applied Sciences. 2012. Available from: http:// researchgate.net/publication/277533245_FLOOD_FORECASTING_MODELING_FOR_THE_BUZI_RIVER_BASIN_IN_MOZAMBIQUE
[4] UN News. Cyclone Idai: Emergency getting ‘bigger by the hour’, warns UN food agency [Internet]. 19 March 2019. Available from: http://news.un.org/en/story/2019/03/1034951
[5] OCHA. Mozambique: Cyclone Idai & floods situation report no. 19 [Internet]. 29 April 2019. Available from: http://reliefweb.int/report/mozambique/mozambique-cyclone-idai-floods-situation-report-no-19-29-april-2019
Countries: Mozambique, Zimbabwe
River Basin Commission: Joint Water Commission for the Buzi, Save and Pungwe River Basins
Size: 110,420 km2 of which 84,500 (79%) is in Zimbabwe and 23,620 (21%) in Mozambique
Length of main river: 740 km [2]
Population: 3.3 million [1]
The Save Basin is one of three basins shared exclusively between Mozambique and Zimbabwe. Of these, the Save is the only one that lies predominantly in Zimbabwe. Drained by the Save River and its main tributary, the Runde River, the Basin is also home to the largest number of water users in the basins shared between Mozambique and Zimbabwe. [1] It has seen investments in small, medium and large dams over the last 60 years. An intricate network of approximately 60 dams, alongside canals and other transmission systems exists in the Basin, and large irrigation schemes are planned for the future, together with additional large-scale water storage. [3,5]
The Save Basin in Mozambique straddles an area classified as high vulnerability from a climate change perspective and, following an extensive programme of water resource development led by Zimbabwe in the 1980s, is now dry almost on a permanent basis [4]. Rainfall is erratic, and access to water in parts of the Save River which used to flow freely is now only possible through sand abstraction. Mangrove forests can be found in the regions around the delta and estuary of the Save River. [4]
In Zimbabwe, the highest percentage of poor households and the highest population density is found in the Save Basin. Poverty is deepening, and overpopulation and overgrazing are causing overexploitation of natural resources. Unemployment in the region is around 90% and there is a high dependence on subsistence farming, which means the population is vulnerable to drought, hunger and malnutrition, while relying on potentially contaminated water sources.[5]. Zim Asset, is a policy document developed by the Government of Zimbabwe which includes strategies to improve social services, physical infrastructure, food security and value addition in line with comprehensive efforts to indigenise and grow the economy. Key areas targeted for growth through Zim Asset are mining, agriculture, tourism and enhanced support for small- to medium-scale enterprises. [7]
Most of the population of the Save Basin depend on mixed subsistence farming. Fifty years ago, communities practiced nomadic farming. For the past 30 years, shifting farming has largely been in place for the poor population. This means that rural settlements are unplanned and depend on high livestock density for power to till land. The erratic rainfall in the Basin can result in the failure of rainfed agriculture. In Mozambique, the risk of harvest loss in rainfed agriculture is more than 50% in all regions south of the Save River. [4]
Climate change has led to an increase in droughts in recent years, extending the dry periods and making crop irrigation more difficult. A 14.7% drop in rainfall was recorded in the Save Basin, Zimbabwe during the last century. [7] The area already has lower than average rainfall, and so even small reductions in rainfall make the Save Basin particularly vulnerable. [1,6]
Local land use, including overgrazing and falling land allocation per person, has led to soil erosion and silt build-up in the river and its associated infrastructure, damaging the river ecosystem. People have been reduced to farming on the edges of rivers where cultivation is banned because of the lack of access to water, which adds to the problem of silt build-up in the river system. [5] Forests are being lost due to exploitation, leading to several species in these habitats becoming endangered. The introduction of alien species such as water hyacinths in the water networks is also threatening local wildlife. [1]
Large-scale farming uses much higher quantities of pesticides and fertilisers than the small-scale communal and resettlement area farmers. In addition, pollution in the air from industry is also infiltrating the water network. [1]
[1] SADC. Shared Watercourses Support Project for Buzi, Save and Ruvuma River Basins: Appraisal report [Internet] 2005. African development fund. Available from: https://www.afdb.org/fileadmin/uploads/afdb/Documents/Project-and-Operations/Multinational_-_SADC_-_Shared_Watercourses_Support_Project_for_Buzi__Save_and_Ruvuma_River_Basins_-_Appraisal_Report.pdf
[2] AHT Group. Kunene River Awareness Kit: Basins of Southern Africa [Internet] 2010. Available from: http://www.kunene.riverawarenesskit.com/KUNENERAK_COM/EN/RIVER/GEOGRAPHY/BASINS_OF_SOUTHERN_AFRICA.HTM
[3] James, A. Workshop Hastens Progress as Save River Basin Project Phase 2 Gains Momentum. 17 May 2019 [Internet]. Available at: http://cridf.net/blog/workshop-hastens-progress-as-save-river-basin-project-phase-2-gains-momentum/
[4] FAO. Country Profile: Mozambique. 2016. Available from: http://www.fao.org/3/i9805en/I9805EN.pdf
[5] CRIDF. Pathways to Impact: Dam Operating Rules and Community Tools to Ensure Water for All in the Save Basin. 2019. Available from: http://cridf.net/RC/wp-content/uploads/2019/03/P2842_P2I_Save_v1.pdf
[6] CRIDF. CRIDF’s Presence in the Save River Basin: Flowing Towards Cooperative Water Management [Internet] 2018. Available from: http://cridf.net/RC/wp-content/uploads/2018/04/Extlib67.pdf
[7] UN Zimbabwe. Zimbabwe Country Analysis Working Document: Final Draft [Internet] 3 October 2014. Available at: http://www.zw.one.un.org/uninzimbabwe/zimbabwe-country-profile
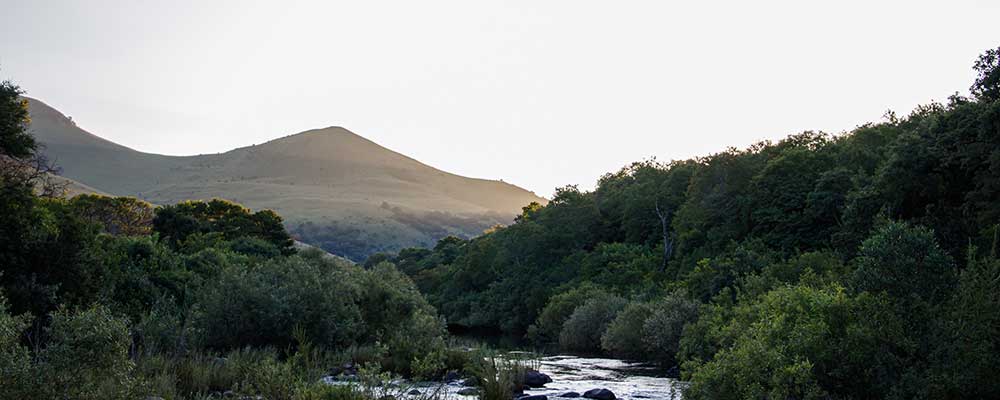
Countries: eSwatini, Mozambique, South Africa
River Basin Commission: Tripartite Permanent Technical Committee (TPTC)
Size: 49,000 km2
Length of main river: 480 km
Population: 2.3 million [1]

The Incomati Basin spans areas of eSwatini, Mozambique and South Africa and covers approximately 49,000 km2. The Basin is home to the Incomati River, an international river system that originates in northeast South Africa and flows through northwest eSwatini before traversing Mozambique into the Indian Ocean.

Unlike many other basins in Southern Africa, the Incomati Basin does not have a single river basin organisation that oversees the administration of the whole Basin. Instead, there are a number of bilateral and trilateral agreements in place between the three countries that regulate the use of the water in the Incomati Basin. The most recent of these is the Tripartite Interim Agreement, which sets limitations on water use in each of the Basin states, establishes target flows to be maintained to sustain the riverine ecology, and sets water quality standards. [2]
Organisations responsible for implementing the legal requirements in the Incomati Basin include the following:
The Incomati Basin encompasses six sub-basins: the Komati, Crocodile, Sabie, Massintonto, Uanetze and Mazimchopes. [3] Approximately 12% of the Basin (638,000 ha) is used for rainfed agriculture, forest plantations and livestock grazing, while about 5% (260,000 ha) is used for irrigated agriculture. [3] The estimated total net runoff in the Basin is 3,587 million m2 per year, of which 82% is generated in South Africa, 13% in eSwatini and 5% in Mozambique.
About 80% of runoff is generated between the months of November and April. [1] The Incomati Basin lies within the summer (October–March) rainfall region of Southern Africa. The Basin as a whole has an average rainfall of 740 mm per year, and is characterised by rainfalls in the high altitude western region with a mean annual precipitation between 800 and 1,000 mm per year. [1]
In recent decades, the Lower Incomati Basin in Mozambique, has been flooded frequently. The floods that occurred in the three consecutive years of 2012, 2013 and 2014, would usually have been expected once in five years, illustrating the impact of climate change in the Basin. Sugar estates have incurred substantial losses, and smallholder outgrowers, subsistence farmers and local communities have suffered considerable hardship, as a result of this flooding. [4]
Despite its economic significance, the Incomati Basin has no major urban developments. The nearest large city is Maputo which lies just outside the Basin. It is estimated that 2.3 million people currently reside in the Basin. [1,5]
Economic developments in the Basin since the 1970s have resulted in increased water use. Water is used by forest plantations and for domestic and industrial needs, while irrigation is the major water user (48% of total use). From the late 1960s, major dams have been commissioned to enable increased water withdrawals at increasing levels of assurance. [1]
These developments have boosted the economies of the three riparian countries, but have also impacted on the environment. In the Tripartite Interim Agreement, the three riparian countries agreed to increase withdrawals to about 2,340 million m2 per year. This represents 65% of the mean annual runoff. The same agreement also made an allowance for environmental flows to mitigate degradation. The allowed increase in water withdrawal raises many issues, one of which is the downstream impact on the estuary. [1]
Agriculture is the primary water consumer inside the Basin. The main crops cultivated are sugarcane, citrus, sub-tropical fruits, tobacco and vegetables. Irrigated agriculture is the mainstay of the Basin’s economy, especially within the Komati and Crocodile catchments, with most of the irrigated land in the Basin is in the hands of large corporations, especially in the Crocodile catchment. [2]
The main economic activities in the Lower Incomati Basin are commercial sugar farming and sugar production. The main estates, Tongaat Hulett at Xinavane and Illovo Sugar at Maragra, have responded to more frequent floods by protecting and isolating flood-prone areas on their estates – building dykes and flood embankments, excavating channels and diverting water courses. This, in turn, has exacerbated flooding in unprotected areas. In contrast, outgrowers supplying the sugar companies from their smallholdings, as well as local communities, are often very exposed to floods. Until 2014, the measures put in place by sugar companies to prevent cane fields being flooded were largely uncoordinated and reactive, and were undertaken without considering or understanding the overall hydrodynamics of the floodplain. [6] As a result, these measures may have exacerbated the risk of flooding in some areas, may have adversely affected the wetland system, and may have lengthened inundation periods, thus transferring the negative impacts of floods to vulnerable households. [4]
In addition, a steady increase in irrigated area is expected to result in water shortages from 2030 onwards. [1]
[1] CRIDF. Case Study: Incomati Basin. Investing in Flood Risk Management Reduces Flood Vulnerability and Builds Climate Resilience. 2018. Available from: http://cridf.net/RC/publications/case-study-on-public-private-partnerships-to-manage-flood-risk-in-the-lower-incomati-basin-mozambique
[2] Slinger JH, Hilders M, Juizo D. The practice of transboundary decision making on the Incomati River: Elucidating underlying factors and their implications for institutional design. Ecology and Society. 2010;15
[3] De Boer FS, Droogers P. Water Allocation Models for the Incomati River Basin, Mozambique. Wageningen: FutureWater. 2016. Available from: https://www.futurewater.nl/wp-content/uploads/2016/06/WAM_Incomati_ARA-Sul_FINAL.pdf [4] Department of Water and Sanitation, South Africa. Chapter 5: The Inkomati Catchment Management Agency. In: Governance Board Training Manual. Available from: http://www.dwa.gov.za/IO/Docs/CMA/CMA%20GB%20Training%20Manuals/gbtrainingmanualchapter5.pdf
[5] Hellegers PJ, Jansen HC, Bastiaanssen WG. An interactive water indicator assessment tool to support land use planning. Irrigation and Drainage. 2012;61(2):143–154 [6] Juízo D, Hjorth P. Application of a district management approach to Southern African river basin systems: The case of the Umbeluzi, Incomati and Maputo river basins. Water Policy. 2009;11:719–730
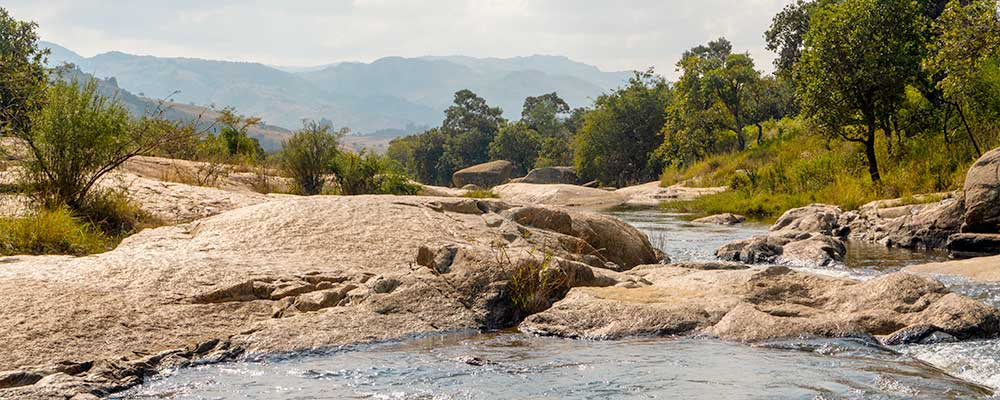
Countries: eSwatini, Mozambique, South Africa
River Basin Commission: Agreement between Mozambique and eSwatini
Size: 5,400 km2
Length of main river: 200 km [1,2]

The Umbeluzi rises at around 2,000 m altitude in the highland of ESwatini, flows eastwards and discharges into the Indian Ocean from Espírito Santo Estuary in Southern Mozambique. Rainfall in the Basin varies from 1500 mm per year in the highlands to 500 mm per year in the lowlands, with most of it falling in the wet season between November and April.
As South Africa has slightly less than 2% of the Basin area, it does not participate in any management of the Basin and the riparian states are often considered to be the two states of Mozambique and ESwatini. [2–4]
There is little cultivated land in the Umbeluzi Basin, and only one isolated urban area. Rainfed croplands are maintained in ESwatini, where broadleaved deciduous forest or woodland also covers up to 40% of the area. The Basin area in Mozambique, in contrast, is 80% needle-leaved deciduous or evergreen forest, with the remainder mostly broadleaved deciduous forest and less than 10% grasslands. [5]
The south of Mozambique has seen reduced rainfall over the last 30 years, by approximately 2 mm per year, and in January 2018 a ban was imposed on using Umbeluzi water for irrigated agriculture after the main drinking water source for the Maputo urban area, the Pequenos Libombos reservoir, was found to be only 20% full. [6] Swaziland has also been hit by droughts in recent years, making water management in the area of vital importance. [7]
Poverty is widespread within the Basin. The rural population of Mozambique has the highest level of poverty at 38%. Although the rate of poverty is decreasing in Mozambique, the actual number of poor people is increasing due to population growth.
The main competitors for the water from the river are irrigated sugar cane production and urban water supply for Maputo, the capital city of Mozambique. [8,9]
Irrigated sugarcane production is one of the main features of the Basin in ESwatini. Banana plantations are cultivated in the Umbeluzi valley in Mozambique, as well as smallholdings managed by individuals. [6] Maize, sold to the local markets, is also grown.
Increased water demand by the current uses of irrigated agriculture and urban water supply are exacerbated by climate change, the reason for the reduction in rainfall recorded over the past 30 years. Leaks in the urban water system are also a contributor to excess water use, so improving the quality of the pipe network would prevent these losses. [10] Salt intrusion into the Umbeluzi is also becoming a problem.
There is very limited information available about the river flow, temperature, precipitation and population in the Basin. This hinders informed decision making about how the water should be allocated.
The estimated surface water demand in 2014 was 350 million m3 per year but is forecast to rise to 586 million m3 per year by 2025. [3]
Population growth is projected to rise by 2% per year, and increased demands from the population will increase the strain on this water source.
[1] GIZ. Basins of Southern Africa.
[2] FAO. Mozambique: International water issues [Internet]. Available from: http://www.fao.org/nr/water/aquastat/countries_regions/Profile_segments/MOZ-IntIss_eng.stm
[3] Droogers P, Boer F De, Terink W. Water Allocation Models for the Umbeluzi River Basin , Mozambique. 2014;31(December):66.
[4] Juízo D, Hjorth P. Application of a district management approach to Southern African river basin systems: The case of the Umbeluzi, Incomati and Maputo river basins. Water Policy. 2009;11(6):719–30.
[5] Droogers P, Boer F De, Terink W.:43.
[6] UN Office for the Coordination of Humanitarian Affairs. Mozambique: Country profile [Internet], 2019. Available from: https://www.unocha.org/southern-and-eastern-africa-rosea/mozambique
[7] FAO. Swaziland looks to a revitalized agriculture sector [Internet], 2019. Available from: http://www.fao.org/in-action/swaziland-looks-to-a-revitalized-agriculture-sector/en/
[8] Juizo D, Lidén R, Vaz ÁC. Remaining challenges for bi-national agreements on shared water: The Umbeluzi case. Water Policy. 2006;8(3):231–53.
[9] CGIAR. Summary of CPWF Research in the Limpopo River Basin.
[10] Droogers P, Boer F De, Terink W.:26.
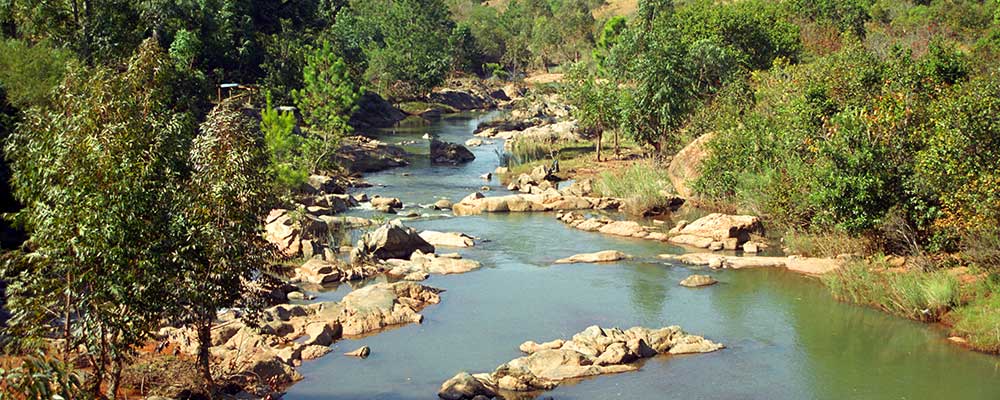
Countries: eSwatini, Mozambique, South Africa
River Basin Commission: Tripartite Permanent Technical Committee (TPTC)
Size: 32,000 km2
Length of main river: 300 km
Population: 1.44 million [1]
The Maputo-Usutu-Pongola River Basin, managed by the Inco-Maputo Tripartite Permanent Technical Committee, is chiefly located in eSwatini, flanked by South Africa and Mozambique. The Maputo and its two main tributaries, the Usutu and Pongola, all flow in a general eastward direction; the Usutu mainly flows through eSwatini, the Pongola through South Africa and the Maputo through Mozambique. The Maputo then discharges into the Indian Ocean via Maputo Bay. At the point where the Maputo drains into Maputo Bay, annual outflow is estimated at 3,797 million m3.
The total population of the Basin in estimated at 1.44 million people, of whom 76% live in rural areas. The population is expected to increase to 1.64 million by 2030, with 80% living in rural areas. [1]
The main topographic features of the Basin are the escarpment with its central plateau in the west, and the Lebombo mountains, which lie to the east of eSwatini. Climate in the region varies from cool near inland towards the escarpment to sub-tropical near the coast. Average rainfall ranges from as high as 1,500 mm per year in the mountainous regions to the west to around 600 mm per year in the low-lying coastal areas to the east and northeast. Rainfall is seasonal, with roughly 80% of the rain falling between October and March. The geology in the interior is mainly sedimentary rock, while the coastal region is mainly mineral-rich sands. [2] The Basin flows through an area of rich biodiversity, as recognised by UN Environment, and 6% of the land enjoys the status of a world conservation area. [3]
In Mozambique, the Maputo Basin is located in one of the poorest districts, where many years of war and political instability have negatively impacted economic and social development. [4] In South Africa, the socio-economic situation is mixed, with substantial economic activity in some areas (chiefly commercial forestry and irrigated cash crop production), and subsistence farming in more rural, poorly-connected areas. [4] In eSwatini, the Maputo Basin and its sub-catchments comprise over half of the country. Economic activity in the rural northern and western reaches of eSwatini is dominated by sugarcane production and commercial forestry, while the more urban areas focus on the manufacturing industry. The tourism and recreation industries in the Basin are also growing.
Although South Africa and eSwatini have been developing their water infrastructure over the last 65 years, water resources infrastructure along the Maputo River is minimal. What water infrastructure the Basin does have was originally built to facilitate the irrigation of sugarcane plantations in eSwatini and the transportation of minerals for export down the Maputo to Maputo Bay. River infrastructure in Mozambique, includes hydropower dams originally built to provide power to mining companies in South Africa. Not all inhabitants of the Basin, therefore, benefit from the existing water infrastructure.
There are various forms of agricultural land use in the Basin, including commercial forestry, with 36,700 ha of timber plantations managed in the Basin. [1] Stock farming of cattle, sheep and goats is also practised.
While eSwatini, Mozambique and South Africa all have a growing large-scale sugar industry, Mozambique is still dominated by smallholder farming, which accounts for nearly 98% of Mozambique’s production industry. Alongside sugarcane, key crops grown in the Basin include maize, cassava, rice and bean. [5]
Within the Basin, eSwatini is the main user of irrigation water, followed closely by South Africa, while Mozambique has a comparatively low demand. [4] The rapid expansion of the sugar industry in the South African and eSwatini areas of the Basin over the last few decades has caused a significant increase in water demand. This has resulted in more water being diverted from the Maputo River, leading to a reduced flow to Mozambique. Total irrigation potential in Mozambique has been estimated at 3.1 million ha. [5] If Mozambique were to irrigate its agricultural land to the extent of its neighbours – which it is expected to – water demand in the Basin would increase significantly, putting further pressure on water resources.
The Basin typically suffers from two climate extremes: drought in the mountainous west, and flooding in the coastal east. Rising sea levels present a flood threat to the Basin’s low-lying settlements in Mozambique, while salt intrusion threatens its coastal agriculture. [6] The Basin’s mangroves and swamps protect Mozambique’s coast from storm surges, so any reduction in the extent of these ecosystems will increase the region’s susceptibility to flooding. [4] Rising temperatures threaten the amount of water available further inland, and make it harder to equitably share the already sparse water resources.
[1] TPTC. Joint Maputo River Basin Water Resources Study [Internet]. 2009. Available from: http://www.dwaf.gov.za/maputobasinatlas/JMRBWRS_Atlas.html
[2] Basson MS, Rossouw JD. Usutu to Mhlatuze Water Management Area: Overview of Water Resources Availability and Utilisation. 2003. Available from: http://www.dwaf.gov.za/Documents/Other/WMA/6/optimised/overview/USUTU%20TO%20MHLATHUZE%20REPORT.pdf.
[3] FAO. Mozambique. In: Irrigation in Africa in figures – AQUASTAT Survey 2005. Available from: http://www.fao.org/nr/water/aquastat/countries_regions/moz/MOZ-CP_eng.pdf.
[4] Hake S. The Mission of Suppling Maputo with Freshwater: A Political and Environmental Water History. Uppsala University Department of Archaeology and Ancient History. 2016. Available from: https://uu.diva-portal.org/smash/get/diva2:1114733/FULLTEXT01.pdf.
[5] FAO. Mozambique. AQUASTAT [Internet]. 2016. Available from: http://www.fao.org/nr/water/aquastat/countries_regions/MOZ/index.stm.
[6] UN-HABITAT. Climate Change Assessment for Maputo, Mozambique: A Summary. 2010. Available from: https://unhabitat.org/books/climate-change-assessment-for-maputo-mozambique.
