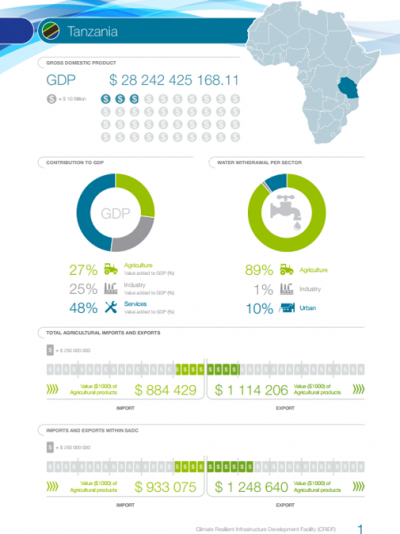
Water and the economy in Southern Africa infographics: Tanzania
This infographic provides a visual overview of the role of water in driving the economy of Tanzania. The infographic may be used to assess the country’s vulnerability to variations in the availability of water and other potential stresses induced by climate change. The document is intended to be primarily comparative rather than directly quantitative in…
Year: 2015
File size: 315 KB
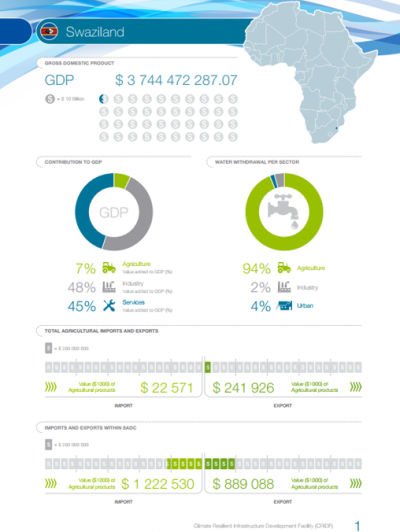
Water and the economy in Southern Africa infographics: Swaziland
This infographic provides a visual overview of the role of water in driving the economy of Swaziland. The infographic may be used to assess the country’s vulnerability to variations in the availability of water and other potential stresses induced by climate change. The document is intended to be primarily comparative rather than directly quantitative…
Year: 2015
File size: 288 KB
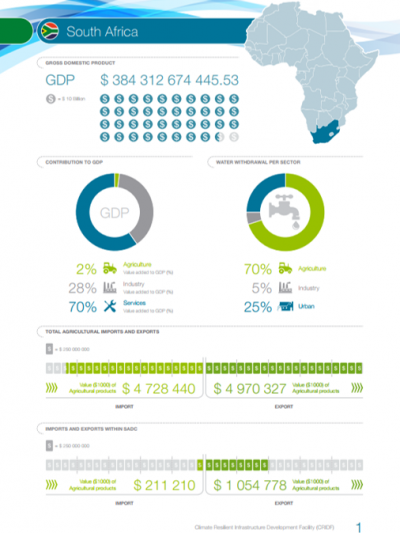
Water and the economy in Southern Africa infographics: South Africa
This infographic provides a visual overview of the role of water in driving the economy of South Africa. The infographic may be used to assess the country’s vulnerability to variations in the availability of water and other potential stresses induced by climate change. The document is intended to be primarily comparative rather than directly quantitative…
Year: 2015
File size: 292 KB
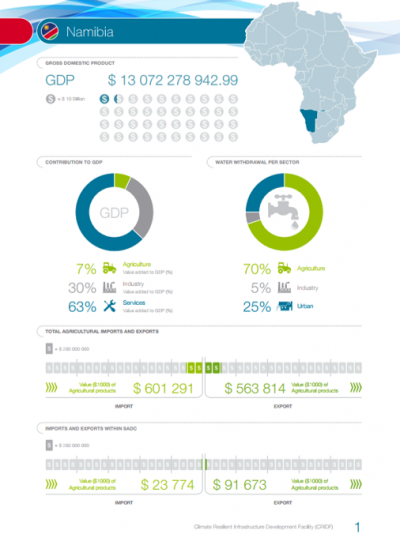
Water and the economy in Southern Africa infographics: Namibia
This infographic provides a visual overview of the role of water in driving the economy of Namibia. The infographic may be used to assess the country’s vulnerability to variations in the availability of water and other potential stresses induced by climate change. The document is intended to be primarily comparative rather than directly quantitative in…
Year: 2015
File size: 307 KB
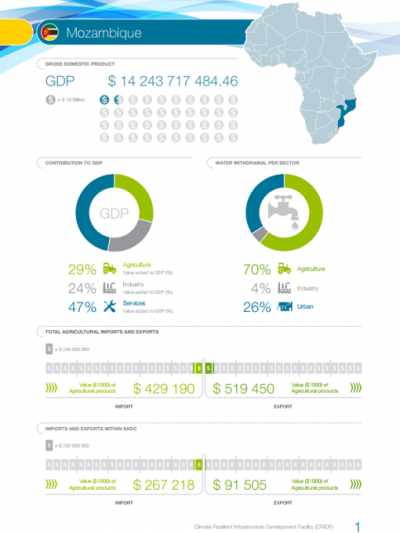
Water and the economy in Southern Africa infographics: Mozambique
This infographic provides a visual overview of the role of water in driving the economy of Mozambique. The infographic may be used to assess the country’s vulnerability to variations in the availability of water and other potential stresses induced by climate change. The document is intended to be primarily comparative rather than directly quantitative…
Year: 2015
File size: 305 KB
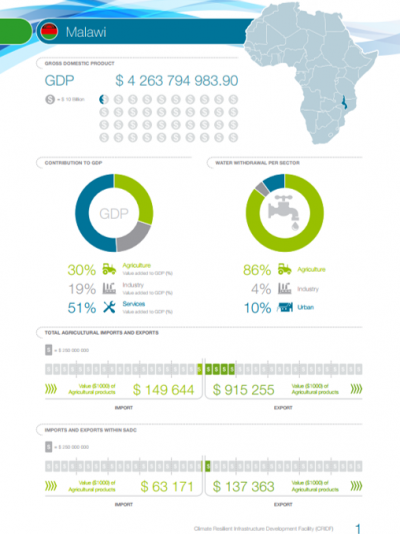
Water and the economy in Southern Africa infographics: Malawi
This infographic provides a visual overview of the role of water in driving the economy of Malawi. The infographic may be used to assess the country’s vulnerability to variations in the availability of water and other potential stresses induced by climate change. The document is intended to be primarily comparative rather than directly quantitative in nature…
Year: 2015
File size: 287 KB
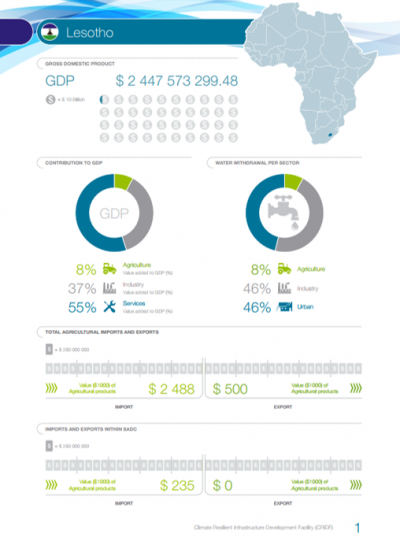
Water and the economy in Southern Africa infographics: Lesotho
This infographic provides a visual overview of the role of water in driving the economy of Lesotho. The infographic may be used to assess the country’s vulnerability to variations in the availability of water and other potential stresses induced by climate change. The document is intended to be primarily comparative rather than directly quantitative in…
Year: 2015
File size: 286 KB
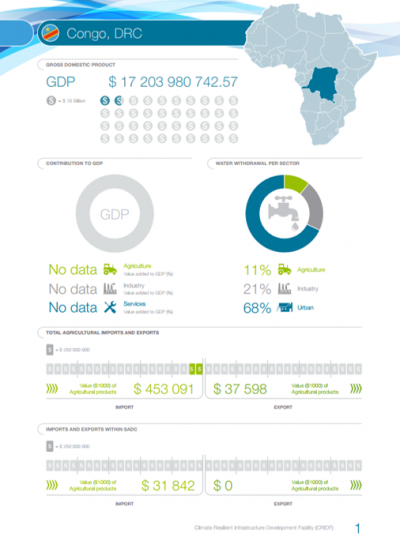
Water and the economy in Southern Africa infographics: Congo, DRC
This infographic provides a visual overview of the role of water in driving the economy of the Democratic Republic of Congo. The infographic may be used to assess the country’s vulnerability to variations in the availability of water and other potential stresses induced by climate change. The document is intended to be primarily comparative rather than directly…
Year: 2015
File size: 300 KB
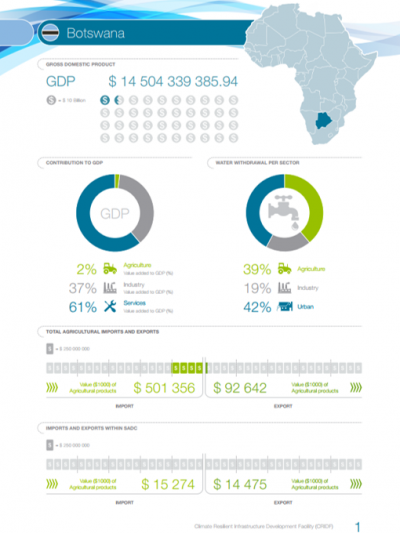
Water and the economy in Southern Africa infographics: Botswana
This infographic provides a visual overview of the role of water in driving the economy of Botswana. The infographic may be used to assess the country’s vulnerability to variations in the availability of water and other potential stresses induced by climate change. The document is intended to be primarily comparative rather than directly quantitative in…
Year: 2015
File size: 286 KB
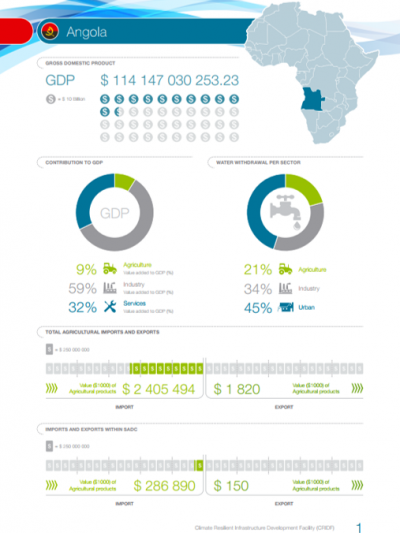
Water and the economy in Southern Africa infographics: Angola
This infographic provides a visual overview of the role of water in driving the economy of Angola. The infographic may be used to assess the country’s vulnerability to variations in the availability of water and other potential stresses induced by climate change. The document is intended to be primarily comparative rather than directly quantitative in nature…
Year: 2015
File size: 284 KB